No Limit to Exponentially Diminishing Returns in Science but Returns can Scale Indefinitely
Scientific progress is a function of the log of knowledge input, and can be scaled seemingly indefinitely.
TL;DR
- Progress comes in a constant step per doubling of input, so exponentially growing effort buys steady, linear progress.
- In manufacturing this is Wright's law. Across 84 technologies, from transistors to the Model T, each doubling of cumulative production cut cost by a median 24%; solar panels got 500 times cheaper over 22 doublings.
- The same shape holds well beyond factories. Of 23 cases, from weather forecasts and planet hunting to fusion and drug discovery, 12 gained a constant amount per doubling of input and 4 more did for part of their record; 6 gained less with each doubling and 1 gained more.
- US research effort rose about 23-fold since the 1930s while productivity growth stayed flat: each doubling of research bought the same step.
- Genetic studies grew 130-fold between 2007 and 2025 and the typical new finding got about 100 times smaller, because the big effects were found first.
- Even so, each doubling of people added a steady 2.3 points to the genetic prediction of schooling, from 2.6% at 127,000 people to 13.3% at 3 million.
- The compute behind frontier AI models has grown 4.9-fold a year since 2010, yet each tenfold of compute removes only about 30% of the error still left.
- Science reorganised to pay the rising cost: mean authors per paper went from 1.7 in 1955 to 6.6 in 2025, solo papers from 57% to 6%, and the wait for a Nobel prize from 13 years to 23.
- Small effects need big samples, which is the replication crisis: repeated in larger samples, 36% of psychology's findings and 61% of economics' held up, at half to two-thirds their original size.
- Three-quarters of Nobel science prizes before 1950 went to one person and 9% have since 2001. The lone genius worked when the frontier was close, not when people were better.
All the detail, caveats and methods are in the supplement.
In 1963, Derek de Solla Price, a historian of science, was looking at how many papers scientists publish. Most publish one or two in a career; a few publish hundreds. He wanted a fair way to say how "big" a scientist is, and he borrowed an idea from psychology. The Weber–Fechner law says our senses respond to ratios, not amounts. A sound ten times more intense does not feel ten times louder; it feels one step louder. A hundred times more intense feels two steps louder.
Price suggested scoring scientists the same way, by the number of zeros in their paper count. He called it "solidness". One paper is a solidness of 0, ten papers 1, a hundred papers 2. The same measure works for a whole field: 10,000 papers is a solidness of 4, and 100,000 is 5.
Then he pointed out a consequence. The scientific literature grows exponentially, multiplying by about ten every 50 years. So while a field's paper count explodes, its solidness rises in a straight line, one step every half-century (Price, 1963, pp. 55–56). That part is just arithmetic.
He then raised the possibility that "solidness", not the raw count of papers, was the better measure of a field's real progress. If so, progress is steady and linear while the effort behind it explodes. He offered it only as a hunch: "I cannot quite see why it is so, or how one might judge it other than by pure intuition" (Price, 1963, p. 56).1
Price was not the first to sense it. Decades earlier, the American philosopher Charles Sanders Peirce had noticed the same thing in chemistry (Peirce, Collected Papers 7.144, quoted in Rescher, 1999, p. 67):
"As the investigation goes on, additions to our knowledge . . . are of less and less worth. Thus, when Chemistry sprang into being, Dr. Wollaston, with a few test tubes and phials on a tea-tray, was able to make new discoveries of the greatest moment. In our day, a thousand chemists, with the most elaborate appliances, are not able to reach results which are comparable in interest with those early ones. All the sciences exhibit the same phenomenon."
The physicist Max Planck described it from the inside (Planck, Vorträge und Erinnerungen, 1949, p. 376, quoted in Rescher, 1999, p. 61):
"with every advance [in science] the difficulty of the task is increased; ever larger demands are made on the achievements of researchers, and the need for a suitable division of labor becomes more pressing."
The intuition that each step costs more than the last is old. Price was the first to give it a quantitative, logarithmic form.2
In 1978 the philosopher Nicholas Rescher turned the hunch into a law, quoting Price's solidness passage as a parallel line of thought (Rescher, 1978, pp. 92–93). The resources poured into science had grown exponentially, he argued, while the stock of first-rate findings had grown only linearly. So the findings grow as the logarithm of the resources. He called this the law of logarithmic returns (Rescher, 1978, p. 91). He later put it more bluntly: "exponential growth in I is coordinated with a merely linear growth in K", where I is information and K is knowledge (Rescher, 1999, p. 62). Each doubling of effort buys about the same step forward.
If they were right, it changes how we should read the history of science. When each doubling of effort buys the same step, the first steps are cheap and the later ones expensive. Newton had the laws of motion and gravity in front of him, waiting for anyone with the mathematics to state them. Nobody can discover them again. What is left are the problems that defeated everyone before, and each now takes more people, more money, more data and more time. Breakthroughs get smaller relative to the effort behind them, and the lone pioneer gives way to the team. The giants really did take bigger steps, and today's scientists really are taking smaller ones. That is not a decline. It is the shape the curve was always going to have.
I think Price and Rescher were right, and in this post I show why. Across fields as different as aircraft, genetics and AI, scientific progress has kept a steady pace only because the effort behind it has grown exponentially, while the return on each unit of that effort has fallen just as fast.
Wright's law: each doubling of production cuts cost by a constant share
In 1936 an aeronautical engineer called Theodore Wright published an observation about building planes. Every time a factory doubled the total number of a given aircraft it had built, the average labour needed per plane fell by a constant fraction, about 20% (Wright, 1936, p. 124). Build 10 planes, then 20, then 40, then 80: each doubling cuts the cost by the same share. Wright credited workers' practice, fewer design changes and, as "one of the principal factors", better tooling.
"Wright's law" has since been found almost everywhere things are made. Tested on 62 technologies, it forecast costs best of the simple rules tried (Nagy et al., 2013).3
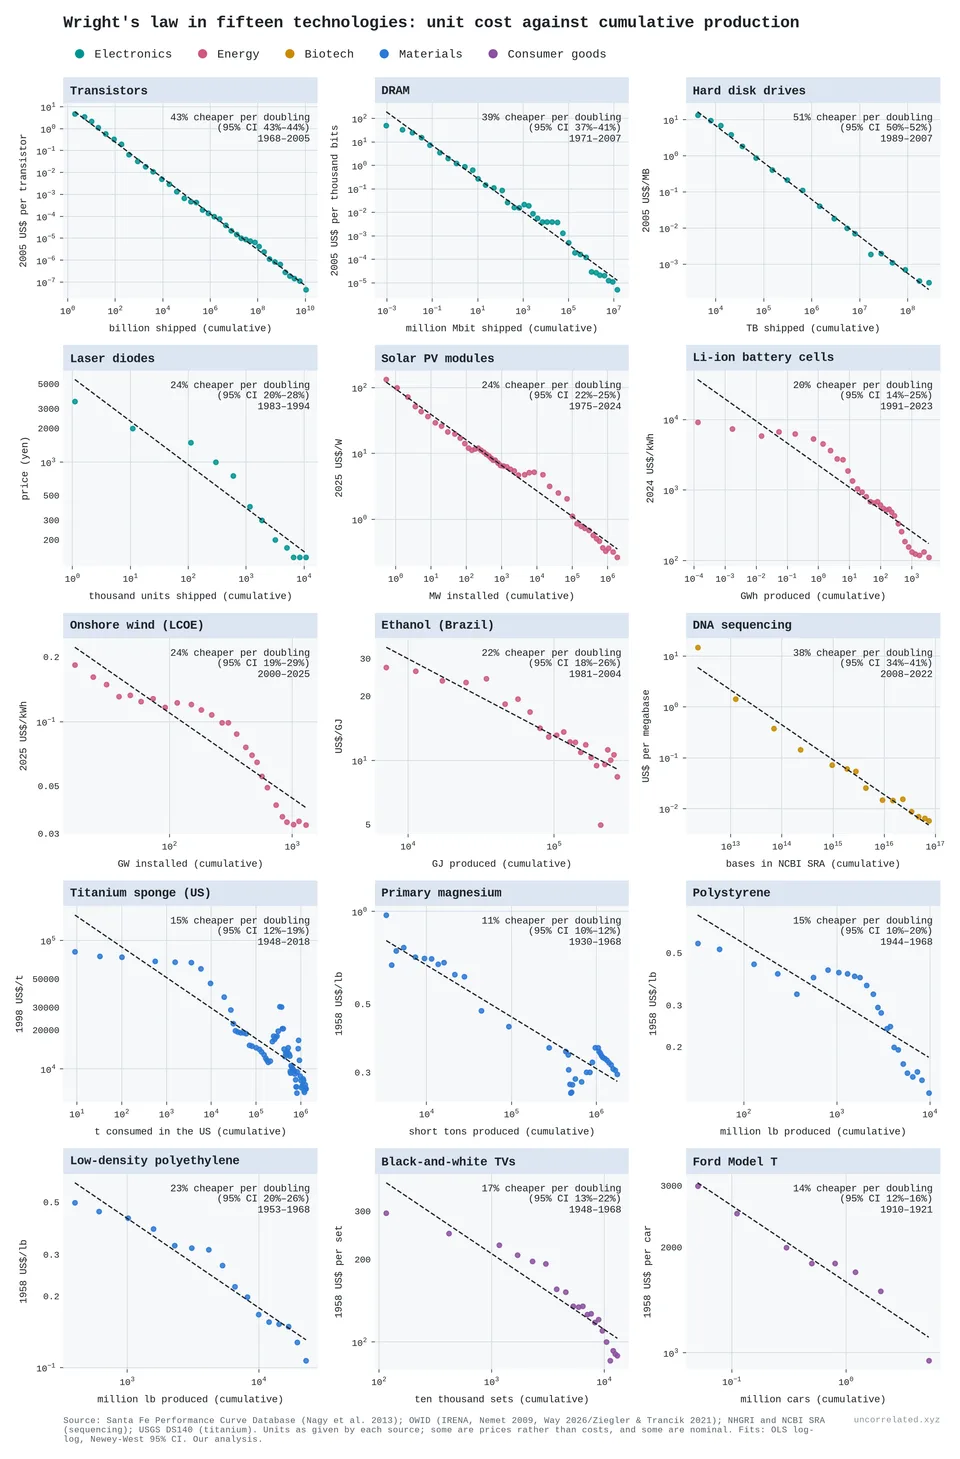
Figure 1: Unit cost against cumulative production on log-log axes for fifteen technologies, each in its own units, with fitted learning rates (cost decline per doubling) and 95% CIs. Some series are prices, not costs, and some are nominal, as in each source. Sources: Santa Fe Performance Curve Database; Our World in Data; NHGRI and NCBI; US Geological Survey. Our analysis.
Solar panels are the famous case. A watt of solar modules cost about 500 times more in 1975 than in 2024. Over those years the world's cumulative production of panels doubled about 22 times, and each doubling cut the price by about 23.5% [our analysis]. The fit is very tight: across the 50 years, the logarithm of the price tracks the logarithm of cumulative production with a correlation of −0.99 [our analysis].4
Two important facts to note:
-
The step per doubling is constant, so the cost of each step grows. Going from the 10th to the 20th plane costs ten planes' worth of work. Going from the millionth to the two-millionth costs a million. The improvement is the same.
-
Prices can only keep falling fast if production keeps growing fast. Solar costs fell about 10% a year for decades because cumulative production kept doubling every couple of years.5 The famous exponential fall in solar prices is not a separate law. It is Wright's law fed with exponentially growing input.
What accumulates is the trials, not the money spent on them. Money only buys units built, bases sequenced or examples trained on, and the price of each keeps changing. For nine cases I compared the two inputs. I fitted progress against doublings of trials and against doublings of dollars on the first half of the years, then used each line to predict the second half. Trials predicted better in eight of the nine, with errors about half as large [our analysis; S1].6
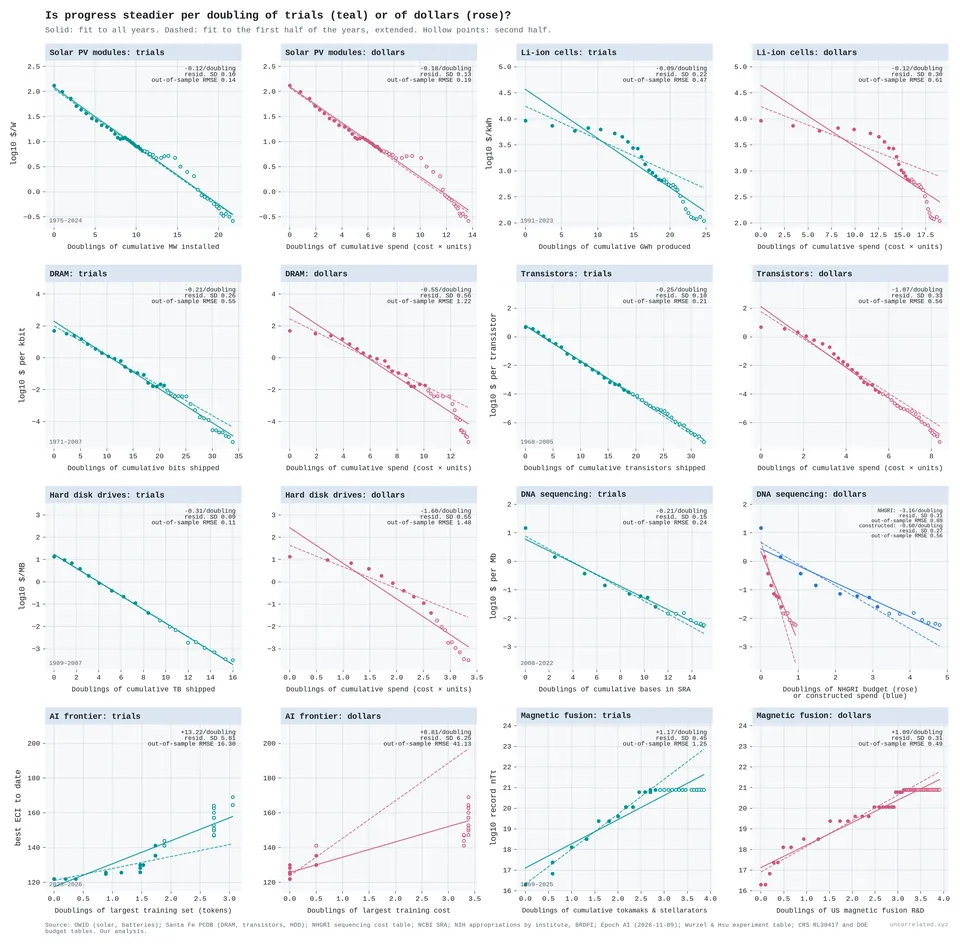
Figure 2: Progress against doublings of cumulative trials (teal) and of cumulative dollars (rose), with the same vertical axis in each pair. Solid lines are fitted to all years. Dashed lines are fitted to the first half of the years and extended; hollow points are the second half. Sources: Our World in Data; Santa Fe Performance Curve Database; NHGRI; NCBI; NIH; Epoch AI; Wurzel and Hsu; CRS; DOE. Our analysis.
That is the whole idea of this post in miniature. A constant step per doubling of input looks like rapid, steady progress from the outside, as long as the input keeps doubling. Take away the doublings and progress slows.
Progress grows with the logarithm of input
Wright's law is about factories. The question is whether research works the same way.
The best-known evidence is a 2020 paper by Nicholas Bloom, Charles Jones, John Van Reenen and Michael Webb, "Are Ideas Getting Harder to Find?" (Bloom et al., 2020). They counted the effective number of researchers behind US economic growth and found it had risen about 23-fold since the 1930s, while the growth rate of productivity had not risen at all. Research productivity, ideas per researcher, fell about 41-fold.7
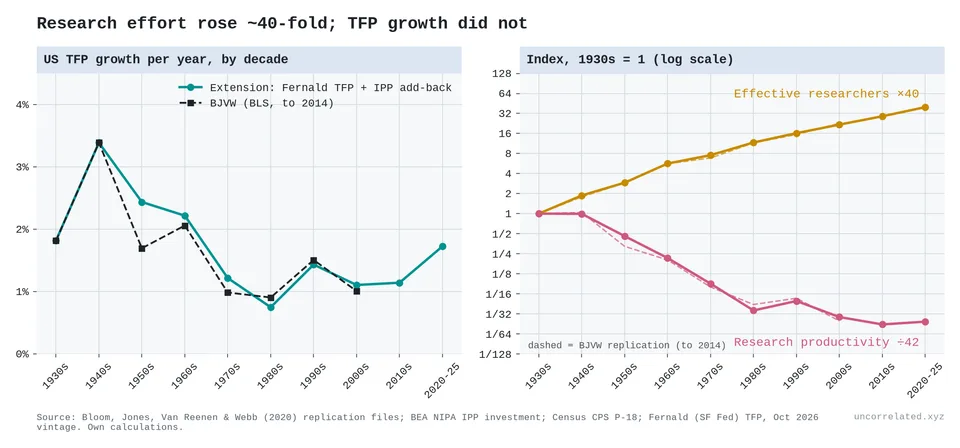
Figure 3: Left: US productivity (TFP) growth per year by decade, from Bloom et al.'s data (dashed, to 2014) and our extension with Fernald's TFP series (solid, to 2025). Right: effective researchers rose about 40-fold since the 1930s while research productivity fell about 42-fold. Log scale.
"Ideas getting harder to find" sounds like bad news. It is exactly what a constant step per doubling predicts. If each doubling of research buys the same step, and the number of researchers doubles every couple of decades, growth stays flat while productivity per researcher falls steadily. Plotting US productivity against the cumulative number of researchers since 1948, a logarithmic curve fits far better than a straight line or a power law. Each doubling of cumulative research has bought about the same gain, 0.21 log points of productivity [our analysis; S2].
It also resolves an old argument. Optimists point to the flood of papers and patents. Pessimists point to flat growth. Both are right. Counts of papers and patents grow in step with spending, or faster [our analysis]. What falls is how far each one moves the frontier. Rescher put it as "scientific knowledge does not correlate with the brute volume of scientific information, but only with its logarithm" (Rescher, 1999, p. 43).
Productivity is an abstract measure, so I ran the same test on things measured physically, each against its own input. The table summarises them; each has a fuller treatment in the supplement, and genomics and machine learning get a closer look below.
| Case | Input | Gain per doubling of input | Log diminishing returns? | Sources |
|---|---|---|---|---|
| Weather forecasts (ECMWF) | Computing power | 0.13 days of useful forecast, over 25 doublings with no bend | Yes | ECMWF skill; ECMWF computers; S3 |
| Solar modules | Cumulative production | 23.5% cheaper, over 22 doublings, 1975–2024 | Yes | OWID; S1 |
| Fine-structure constant | Atomic-physics literature | 1.08 extra digits of precision, 1963–2022 | Yes | CODATA (NIST); OpenAlex; S3 |
| Genetic prediction (educational attainment) | People in the genetic study | About 2.3 percentage points of variation predicted, 2013–22, barely shrinking | Yes | Okbay et al. 2022; S4 |
| Robots on unseen homes | Distinct training environments | 12–17 percentage points of success, over five doublings | Yes | Lin et al. 2025; S5 |
| Planet hunting (radial velocity) | Planets already found | 0.22–0.24 orders of magnitude smaller detectable wobble, in each decade since 1995 | Yes | NASA Exoplanet Archive; S3 |
| Mersenne primes | Cumulative search work | About 0.59 new primes expected; 18 found against 12 expected over the project | Yes | mersenne.org; S3 |
| Plant species (Kew checklist) | Cumulative taxonomist-years | 76,000–92,000 species in each period since 1900 | Yes | Kew WCVP; S3 |
| US life expectancy | NIH spending | About 2.4 years to 2010, then 0.2; rich-country peers kept 3–4 | Yes (except the US after 2010) | CDC/NCHS; NIH appropriations; S3 |
| Magnetic fusion | US fusion R&D | 1.24 orders of magnitude, 1969–98; no record since 1995 | Yes8 | Wurzel & Hsu; CRS RL30417; S3 |
| Magnetic fusion (machines) | Tokamaks and stellarators built | About 1.7 orders of magnitude, 1969–98; no record since 1995 | Yes8 | Wurzel & Hsu; S1 |
| Breadth of physics (title phrases) | Cumulative physics papers | Faster in 1950–70, then constant per doubling since 1990 | Faster than log (diminishing returns), then yes | Crossref; method; S3 |
| 84 technologies (Santa Fe database) | Cumulative production | Median 24% cheaper | Mostly yes | Performance Curve Database; S1 |
| Language-model error (Chinchilla) | Training compute | 0.27, 0.13, 0.07 and 0.03 units of loss per tenfold, 10²⁰–10²⁶ operations | Slightly faster than log (diminishing returns) | Hoffmann et al. 2022; S5 |
| Computer chess | Hardware speed | 65–75 Elo below 2,200; about 35 near the top | Yes, then faster than log (diminishing returns) | SSDF rating list; S3 |
| DNA sequencing cost | Cumulative bases sequenced | 34–42% cheaper, steady 2008–22 | Yes, with a burst closer to linear (accelerating returns) | NHGRI; NCBI SRA; S1 |
| New drugs | Pharmaceutical R&D | 260–330 more approvals per doubling, 1970–2009; about twice that since 2010 | Yes, then closer to linear (accelerating returns) | FDA approvals; PhRMA R&D (2010, 2022); S3 |
| AI capability (Epoch index; Anthropic's AECI) | Largest training run | About 4 index points before September 2024, about 6 after (within the margin of error); on AECI, progress since October 2025 runs at 1.9 times the earlier rate, with no speed-up in training compute (METR) | Yes, then possibly closer to linear (accelerating returns) | Epoch AI; METR 2026; Sanders 2026; S5 |
| Crop yields | US public agricultural R&D | Rising: 4.4 t/ha of maize in the 1970s, 14.9 in the 2010s | Closer to linear (accelerating returns) | FAOSTAT; USDA ERS R&D; S3 |
| Particle colliders | Particle-physics literature | 0.77 orders of magnitude of energy before 1990, 0.34 after | Faster than log (diminishing returns), and lumpy | Shiltsev & Zimmermann; INSPIRE-HEP; S3 |
| Single-thread chip speed | Chip R&D | 0.89, then 0.50, then 0.39 orders of magnitude | Faster than log (diminishing returns) | Rupp chip data; OECD ANBERD; S3 |
| Breadth of biomedicine (title phrases) | Cumulative biomedical papers | 870 phrases per doubling in 1950–65; none since the mid-1990s | Faster than log (diminishing returns), then hitting a wall | OpenAlex; method; S3 |
| Oil and gas, Norwegian shelf | Cumulative exploration wells | 3,400 million m³ of oil equivalent in 1975–85, 780 in 2015–25 | Faster than log (diminishing returns) | Sodir FactPages; S3 |
Log diminishing returns? Yes: each doubling of input buys about the same gain. Faster than log (diminishing returns): returns diminish faster, so each doubling buys less than the last. Closer to linear (accelerating returns): returns diminish more slowly, so each doubling buys more than the last. Hitting a wall: doublings now buy almost nothing. All rows are our analysis of the public data linked in each row. Methods and caveats are in S1, S3, S4 and S5.
Across fields with nothing in common, from forecasting weather to measuring constants, the same shape keeps appearing: a constant step per doubling of input.9
Genomics: smaller effects need more people, so prediction grows in constant steps
Genomics is the cleanest case, because the argument can be made one step at a time and each step checked against data.
Start with what it takes to find anything at all. A genetic study compares the DNA of many people and looks for variants that go with a trait. Chance alone produces weak associations, so a variant counts as a finding only if its signal stands clear of the noise, and the noise shrinks only as the sample grows. At the standard threshold for significance, a study of N people can detect a variant only if it explains more than about 30/N of the variation in the trait [our calculation]. A study of 3,000 people can see variants that each explain about 1%. To see variants ten times weaker, it needs ten times the people. That follows from the statistics alone, whatever the biology.
It follows that the big effects are found first. The earliest studies, of a few hundred or thousand people, could only have detected large ones. They reported some, for single genes behind traits like depression, and almost none survived.10
The real effects were smaller, and they appeared as the samples grew. I analysed every study in the GWAS Catalog, 1.2 million genetic associations.
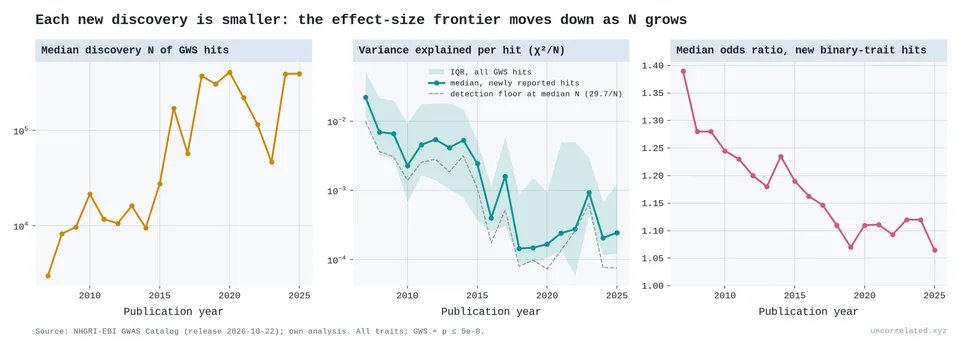
Figure 4: Median discovery sample size of newly reported genetic associations (left); variance explained per new association, with the detection floor implied by sample size (middle); median odds ratio of new disease associations (right). Source: NHGRI-EBI GWAS Catalog. Our analysis.
- The samples grew 130-fold. The median study behind a new finding grew from about 3,000 people in 2007 to about 390,000 in 2024–25, so the smallest effect a study could detect fell 130-fold.
- Each new finding got about 100 times smaller. The variance explained by the typical new association fell from 0.022 to about 0.0002, staying just above the detection floor.11
- The findings kept coming. At every new detection floor, new associations appeared in steady or growing numbers.
Whatever is still undiscovered must be smaller than what has been found. So the next batch of findings always costs a multiple more people than the last.
Those two steps fix the cost of progress: each tier of smaller effects takes a constant multiple more people. The third step is what each tier is worth. Counting findings does not measure it. For height, 130,000 people yielded 240 significant genetic variants and 5.4 million yielded 12,111 (Yengo et al., 2022, Tables 1–2), but the later ones are far weaker. The right measure is how well all the variants together predict the trait.
The cleanest test comes from the studies of educational attainment, years spent in school. Its consortium re-analysed every one of its studies with the same method, so the only thing that changes between them is the number of people (Okbay et al., 2022, Table 1). With about 127,000 people, the genetic score predicted 2.6% of the variation in schooling. With 3 million, it predicted 13.3%. Each doubling of people added about 2.3 percentage points, and the step has barely shrunk: about 2.6, 2.4, 2.2 and 2.2 points per doubling between successive studies [our analysis].12
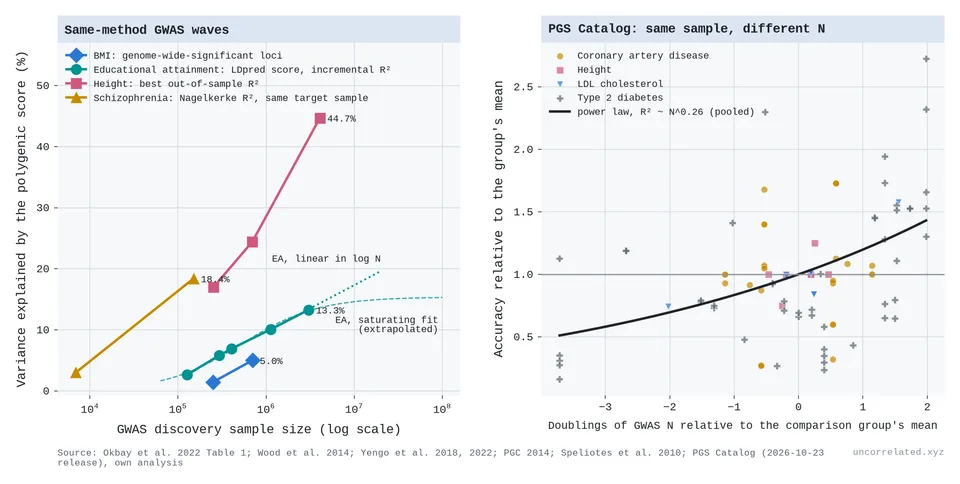
Figure 5: Left: variance explained by polygenic scores against the size of the genetic study, for series analysed with consistent methods (height mixes methods). Educational attainment gains about 2.3 points per doubling; the dashed curve is the textbook saturating fit, the dotted line the straight-line fit extended. Right: the same people scored with genetic studies of different sizes, in the PGS Catalog (35 comparisons, 13 publications). Sources: Okbay et al. 2022; Wood et al. 2014; Yengo et al. 2018, 2022; PGC 2014; Speliotes et al. 2010; PGS Catalog. Our analysis.
So each tier has been worth about the same, and the chain is complete. Exponentially more people buy a constant step each time: logarithmic input, linear output.13
Machine learning: subtler patterns need more data, so error falls in shrinking steps
Machine learning runs on the same logic, with data and computation in place of people. Its practitioners learned the first half of it the hard way. In 2019 the reinforcement-learning researcher Rich Sutton summed up 70 years of AI research in an essay called "The Bitter Lesson". Its first sentence is the lesson: "general methods that leverage computation are ultimately the most effective, and by a large margin" (Sutton, 2019). In chess, Go, speech and vision, researchers kept building their own understanding of the problem into their systems. It helped at first, and then, in Sutton's words, "in the long run it plateaus and even inhibits further progress". The breakthroughs came from search and learning, scaled up with more computation.
The bitter lesson says what worked: more input. What that input costs follows from how learning proceeds. A model learns the commonest, simplest patterns in its data first: frequent words, simple grammar, common facts. The subtler patterns are combinations. One feature changes the meaning of another, and then combinations of features change the meaning of other combinations. There are far more combinations than single features, and each one turns up less often. With 12 features there are 12 single effects to learn, 66 pairs, 220 triples and 495 four-way combinations. A learner has to see each one often enough to tell it from noise, so each layer of subtlety needs a multiple more data than the one before. Like the genetics, this is counting, and it holds whatever the model.
To see what follows, I built a toy model: a target made of four such layers, and a learner that picks up each layer once it has enough data [our simulation]. The first layer took about 30–50 examples to learn and the fourth about 1,500–2,100. What the learner gained for that data depended on what each layer was worth:
- When every layer was worth the same, the error fell in equal steps per multiple of data. That is a logarithm.
- When each layer was worth 35% of the one before, the error fell along a power law: every tenfold of data removed the same fraction of what was left.
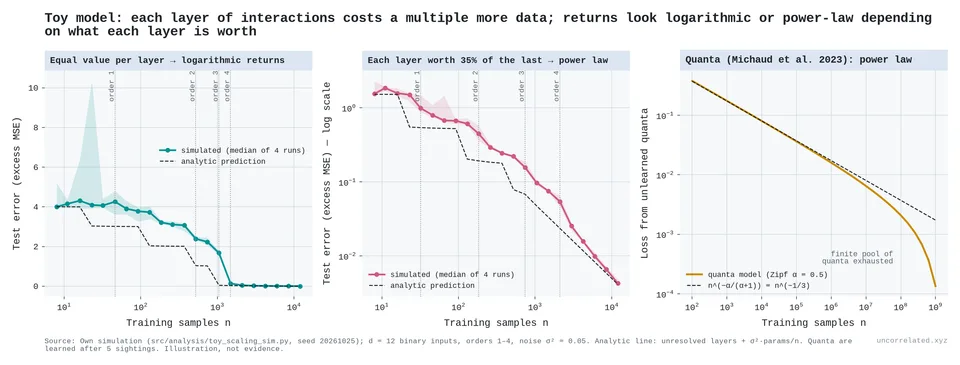
Figure 6: A toy model, an illustration and not evidence. Left: when every layer of interactions is worth the same, test error falls in roughly equal steps per multiple of data. Middle: when each layer is worth 35% of the one before, error falls along a straight line on log-log axes, a power law. Right: a model in which skills are learned in order of how often they are used, with power-law frequencies, also gives a power law (after Michaud et al. 2023). Our simulation.
As in genetics, the logic fixes the cost side: each next layer costs a multiple more data. What each layer is worth decides the shape. Michaud and colleagues reach the same result from a different starting point: if skills are learned in order of how often they are needed, and their frequencies follow a power law, the loss falls as a power law too (Michaud et al., 2023, p. 1).
Real models follow the second pattern. In 2020, researchers at OpenAI showed that a language model's error falls smoothly and predictably as it gets more parameters, more data and more compute (Kaplan et al., 2020, eqs. 1.1–1.3). Later work refined the recipe (Hoffmann et al., 2022). On its fitted curve, each tenfold increase in compute removes about 30% of the error that can still be removed, so the absolute improvement keeps shrinking: from 10²⁰ to 10²⁶ operations, successive tenfold increases buy 0.27, 0.13, 0.07 and 0.03 units of loss (Hoffmann et al., 2022, eq. 10; our calculation). Each layer is worth a little less than the last, so language models sit just short of a logarithm: the cost of each layer is the same multiple, and its value shrinks slowly. Repeating data does not get round this: a model gains little from seeing the same text more than a few times (Muennighoff et al., 2023).
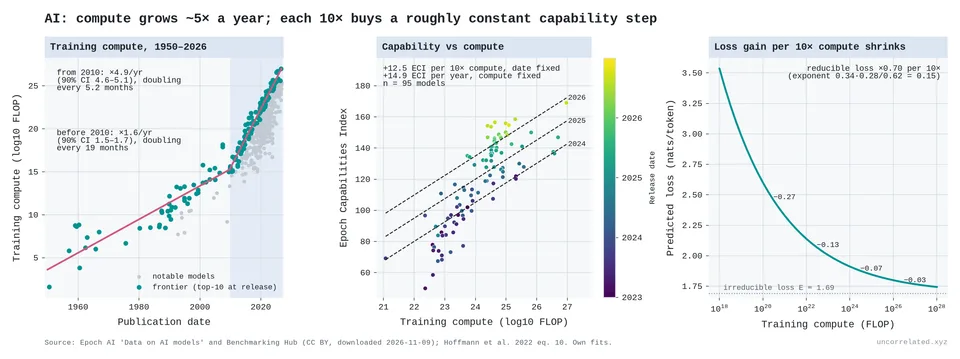
Figure 7: (a) Training compute of notable AI models since 1950, with the frontier trends before and after 2010. (b) Epoch Capabilities Index against compute, coloured by release date. (c) Chinchilla's fitted compute-optimal loss against compute. Source: Epoch AI. Our analysis.
Progress has looked fast because the input has grown faster than anything else in this post. The compute used to train frontier models grew about 4.9-fold a year over 2010–2026, doubling roughly every five months, against about 1.6-fold a year before 2010 (our analysis of Epoch AI data; Sevilla & Rold{\'a}n, 2024).14
What has paid for all those doublings is a feedback loop. Better models attract more users and more investment, which buy more compute and more staff, which make better models.15 Solar had the same loop. Cheaper panels drew in more buyers, and spending on modules grew about 18% a year, from $54 million in 1976 to about $120 billion in 2024, even as each watt got 500 times cheaper [our analysis].16 The loop does not repeal diminishing returns. It hides them, by supplying the exponential input the law demands.
Magnetic fusion shows what happens without the loop. It has no product to sell, its budget fell for twenty years, and it has set no record since 1995.8
Teams, training and prizes have changed as the law predicts
If each step forward needs exponentially more input, several things should follow for the people doing science. All of them can be checked.
First, the work should move from individuals to teams. It has. Across every journal article in OpenAlex's core sources, the mean number of authors in science and engineering rose from 1.7 in 1955 to 6.6 in 2025, a steady 1.8% a year. Solo papers fell from 57% to 6% [our analysis].
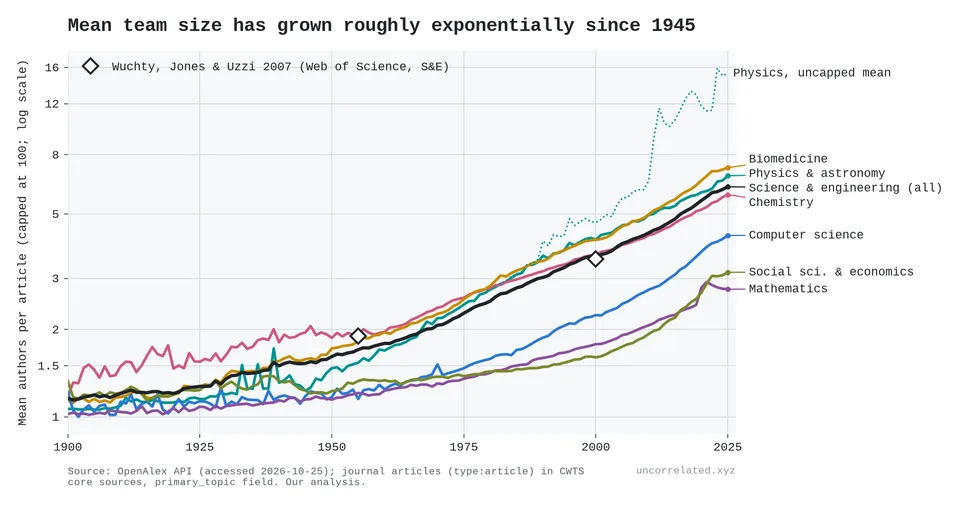
Figure 8: Mean authors per article by field, 1900–2025 (capped at 100). Source: OpenAlex. Our analysis.
Particle physics is the extreme. The 1933 paper reporting the positron had one author. The 1995 papers announcing the top quark had about 400 each. The 2012 papers announcing the Higgs boson had about 2,900 each (INSPIRE-HEP, 2026).17
Second, the climb to the frontier should get longer. If knowledge piles up, everyone has more to learn before they can add to it. The economist Benjamin Jones calls this the "burden of knowledge" (Jones, 2009). On this post's thesis, the frontier deepens with the logarithm of what is known, so the climb should lengthen by a constant amount per doubling of the literature, not in proportion to it.
That is what the data show. The scientific literature doubled about eight times between 1900 and 2025. Over that time the age at which inventors, mathematicians and Nobel laureates reach the frontier rose by roughly a year per doubling (Jones, 2009, pp. 284, 291; Brendel & Schweitzer, 2019, p. 143; our analysis).18 Prize-winning work was done at a mean age of 36–40 in every decade from the 1900s to the 1970s, and at 44–47 for work done in the 1980s and 1990s (Jones & Weinberg, 2011; our analysis). If the burden grew in proportion to knowledge, training would have grown about 250-fold.19
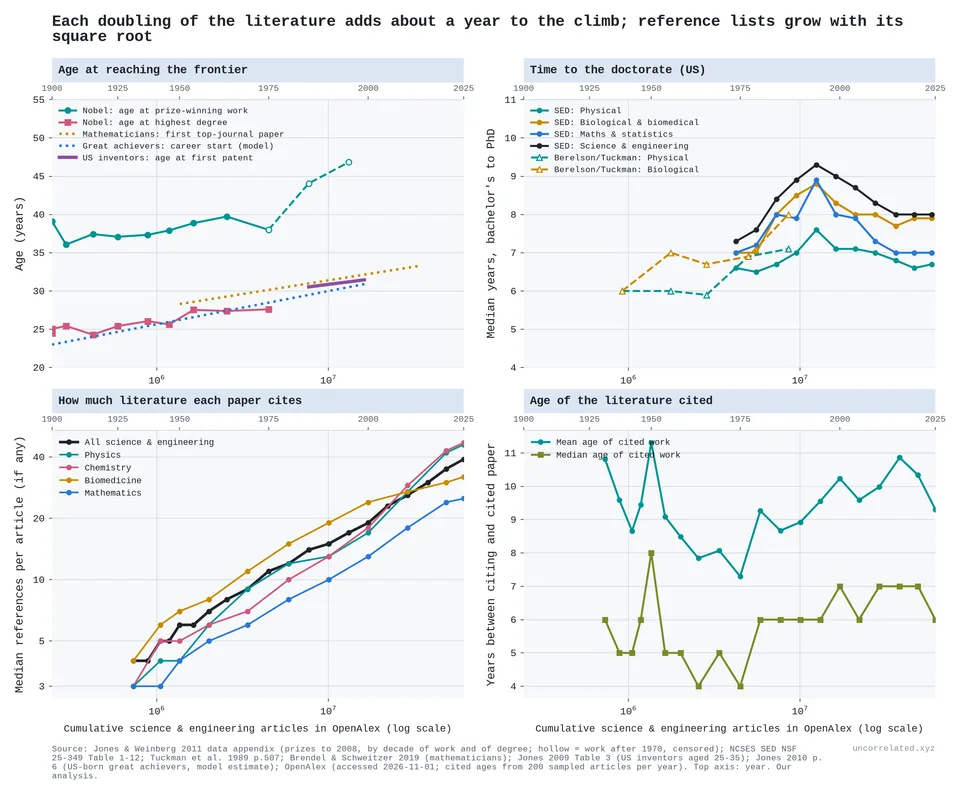
Figure 9: Time to the frontier against the cumulative science literature (log scale). Top left: Nobel laureates' age at prize-winning work and at highest degree, with published trends for mathematicians and inventors. Top right: years from bachelor's degree to PhD in the US. Bottom: references per article and age of cited works. Sources: Jones and Weinberg 2011; NCSES; Tuckman et al. 1989; Brendel and Schweitzer 2019; OpenAlex. Our analysis.
Third, recognition should queue up. The number of Nobel prizes is fixed. If important work keeps arriving faster than prizes are handed out, the queue lengthens. The wait from discovery to prize grew from 13 years to 23, and in physics from 10 to 26 (Jones & Weinberg, 2011; our analysis).
Last, a world with ever more researchers should spread existing knowledge faster, because more people are watching. It has. The average lag between a technology's invention and its adoption across countries fell from about 120 years for steamships to 8 for the internet (Comin & Hobijn, 2010, Table 2; our fit). In a 1922 list of discoveries made independently by more than one person, the median gap between the first and second discoverer fell from 7 years before 1700 to zero in 1850–99 (Ogburn & Thomas, 1922; our transcription).20
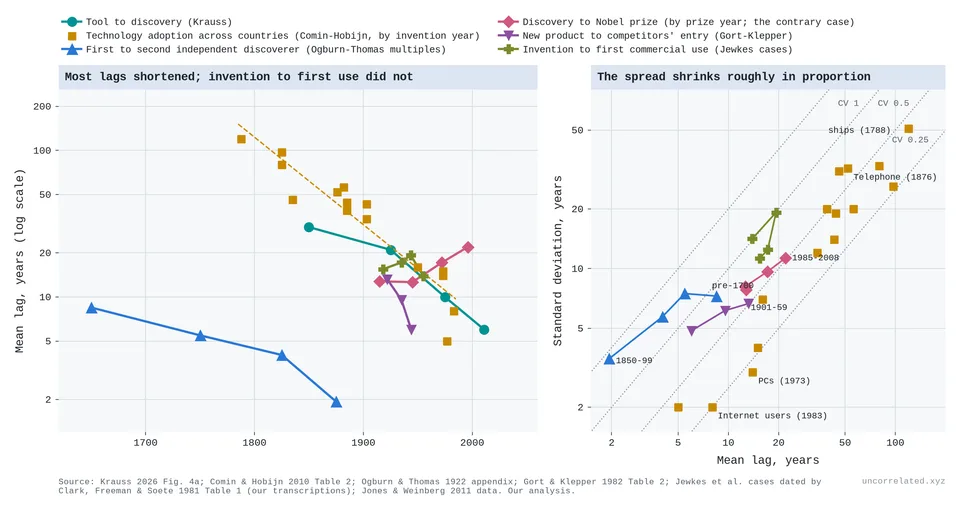
Figure 10: Left: mean lags in years (log scale): tool to discovery; cross-country adoption; first to second independent discoverer; product launch to competitors' entry; invention to first commercial use; and, the contrary case, discovery to Nobel prize. Right: spread against mean for the same lags. Sources: Krauss 2026; Comin and Hobijn 2010; Ogburn and Thomas 1922; Gort and Klepper 1982; Clark, Freeman and Soete 1981; Jones and Weinberg 2011. Our analysis.
Two details fit the thesis better than the falling lags themselves. One is that the lags fall slowly. They halve roughly every 50–70 years, while US research effort doubles about every 16. If doubling the number of eyes on every problem halved the wait, the lags would have collapsed. Instead each doubling of effort cuts them by only about 15–20% [our analysis].
The other is that the hard step did not speed up at all. The time from a workable invention to its first commercial use, the step that needs someone to do something genuinely new, shows no trend across the classic lists, from Newcomen's steam engine to Dacron (Enos, 1962; Clark et al., 1981; our analysis). What got faster is spreading what already exists. Doing the new thing still takes as long as it did. The details, including a famous claim of acceleration that turns out to depend on how inventions were dated, are in S6.
Discussion: Replication Crisis and the Death of Genius
Two things look different to me once progress is read as a logarithm.
The first is the replication crisis. The logic of the genomics section is not special to genetics. Any study can only detect effects larger than its sample allows, and in any field the large effects are found first. A field that goes on running small studies after that point has nothing left that it can detect. What it publishes instead is noise and overestimates, because those are the only results that reach significance. When psychology's well-known findings were repeated in larger samples, 36% gave a significant result again, and the effects came back at about half their original size. In economics 61% did, at two-thirds the size. In cancer biology the repeated effects were 85% smaller (Collaboration, 2015; Camerer et al., 2016; Errington et al., 2021; S7).
I think this was always going to happen. Careless methods and the appeal of a striking result made it worse, but honest science would have reached the same point, because the effects still left to find are smaller than the studies built to find them. Genetics got there first. Its candidate genes were chosen because theory said they should matter, and they proved no more associated with depression than other genes (Border et al., 2019, p. 376). What worked was setting the theory aside, scanning the whole genome, and growing the samples more than a hundredfold. That is the bitter lesson of machine learning in another field. Researchers built what they expected to find into studies too small to contradict them, and more data did better without it. So I read the crisis as a transition each field has to make, from large effects found by one lab to small effects found by consortia. I suspect that some fields which seem stuck are simply on the wrong side of it.
The second is the death of the lone genius, and it is written in the bylines. In 1955 more than half of scientific papers had a single author. Now 6% do. The 1933 paper reporting the positron had one author; the 2012 papers announcing the Higgs boson had about 2,900 each. Three-quarters of the Nobel science prizes before 1950 went to one person, and since 2001 only 9% have. Newton and Darwin were not a different kind of person from the scientists who sign those later papers. They worked when the frontier was close and the steps were large and cheap. Today the frontier is far away, reaching it takes decades of training, and each step takes a team. The size of a discovery tells you where on the curve it was made. It says little about the ability of the person who made it, or about the health of science in their time. A world that kept producing Newton-sized leaps for the same effort would be the strange one. Smaller steps from more people, at a steady pace, are what progress looks like.
The evidence for each claim, with every caveat and the methods, is in the supplement. All figures were produced from public data by scripts in this project's repository.
Footnotes
-
Price did not settle on the logarithm himself. Rescher, who credits the solidness passage, notes that Price elsewhere measured the progress of science by its "stature", which he estimated grows exponentially but two or three times more slowly than the literature, doubling about every 30 years (Rescher, 1978, p. 93, n. 30, citing Price's Science Since Babylon, 2nd ed., 1975, p. 188). It was Rescher who committed to a logarithm. ↩
-
Price is the earliest such formulation we could find, not necessarily the earliest there is. Diminishing returns to research were discussed long before him, as the quotes above show, and someone may well have put them in logarithmic terms earlier. These are also a few voices, not a consensus. Plenty of scientists and historians have argued the opposite; the historian Henry Adams, for one, proposed a "law of acceleration" in which progress speeds up with each generation. ↩
-
Moore's law, a constant percentage fall per year, forecast almost as well: "Wright's law produces the best forecasts, but Moore's law is not far behind" (Nagy et al., 2013). The two are hard to tell apart whenever production grows at a steady exponential rate. Reviews of hundreds of studies put the typical cost decline at 16–20% per doubling of cumulative production (Dutton & Thomas, 1984, p. 238; McDonald & Schrattenholzer, 2001, p. 256; Weiss et al., 2010, pp. 415–417). In the 84 technologies of the Santa Fe Performance Curve Database, the median is 24% [our analysis; S1]. ↩
-
R² = 0.98. Against calendar time the correlation is −0.97 (R² = 0.95). Both are strong because production itself grew exponentially over time [our analysis]. ↩
-
The annual rate of cost decline is almost exactly the learning rate multiplied by the growth rate of production: 0.109 observed against 0.110 predicted for solar (our analysis; Nagy et al., 2013, p. 1). ↩
-
I set this test out before running it. In six of the nine cases the only dollar series is unit cost times units, so it is built from the unit counts and cannot test the idea on its own. Of the three cases with an independent dollar series, DNA sequencing favours trials, AI is mixed, and magnetic fusion favours dollars. Details are in S1. ↩
-
I re-ran their calculations from their own files and got the same numbers, and the pattern survives when the data are extended to 2025 [our analysis; S2]. ↩
-
Magnetic fusion is the clearest case of an input stopping. Its standard measure of progress, the "triple product" of a plasma's density, temperature and confinement time, rose about 40,000-fold from 1969 to 1995, about 1.24 orders of magnitude per doubling of cumulative US fusion spending (Wurzel & Hsu, 2022, p. 062103-21; our analysis). No tokamak has beaten that 1995 record. Strictly, the inputs we counted kept growing: after 1997 cumulative US fusion spending rose 66%, about 0.7 doublings, which at the 1969–98 rate should have bought about 0.9 orders of magnitude more, and the number of tokamaks and stellarators doubled, from 14 to 29. We still count both fusion rows as "Yes" because a new record needs a bigger machine, and the US cancelled every candidate for the next one. The input that matters, record-class machines, stopped. The money fell short too: real US spending peaked in 1977 and fell for twenty years, and where the planners of 1976 priced a demonstration power plant at about $57–63 billion (2025 dollars), the US spent $34 billion from 1978 to 2025 (Research & Development Administration, 1976; our analysis). Measured against dollars, or against machines of any size, fusion has stalled. The full account, including what the old trend implies for SPARC and ITER, is in S3. ↩ ↩2 ↩3
-
The exceptions are in the table, and they fall into a few kinds. New tools bring bursts: DNA sequencing in 2007–10, and new drug approvals since 2010. Thresholds bring jumps: inertial fusion after ignition in 2022. Frontiers held by one giant machine stall between machines: colliders and magnetic fusion. Finite pools run dry: oil on the Norwegian shelf. And research productivity in the aggregate US data has been roughly flat since the 1980s. Each is treated in the supplement (S1, S2, S3, S9). ↩
-
Tested in very large samples, the 18 most-studied depression genes "were no more associated with depression phenotypes than noncandidate genes" (Border et al., 2019, p. 376). ↩
-
For diseases, the typical odds ratio of a new finding fell from 1.39 to 1.07 [our analysis]. ↩
-
The textbook model of this curve is an S-shape that flattens toward a ceiling (Daetwyler et al., 2008, p. 2). Fitted to these studies, it says the step should already have fallen to about 1.3 points. It is still 2.2 [our analysis]. ↩
-
There is a ceiling. Genetic variants can only predict as much of a trait as is genetic in the first place, and height, with the largest samples, is already at about 80–90% of what common variants can explain (Yengo et al., 2022). Near that ceiling, each doubling must buy less. The education score also picks up family environment: controlling for the parents' scores roughly halves the association (Okbay et al., 2022, p. 438). These caveats, and the question of whose DNA counts, are in S4. ↩
-
Better algorithms stretched the compute further: the amount needed to reach a given level of performance halved about every eight months over 2012–2023 (Ho et al., 2024, p. 1). See S5. ↩
-
OpenAI went from 52 staff at the end of 2016 to about 4,500 in early 2026; Anthropic roughly tripled every year from about 50 in 2022 (AI, 2026). ↩
-
Economists call this Jevons's paradox: making something cheaper can raise total spending on it. ↩
-
The Nobel prizes, which at most three people can share, show the same squeeze. One person received 76% of the 127 science prizes of 1901–1950, 32% of the 150 of 1951–2000 and 9% of the 78 of 2001–2026; the mean number of laureates per prize rose from 1.29 to 2.03 to 2.55 [Nobel Prize API; our analysis]. ↩
-
Some of this is demography: about 40% of the rise in age at great achievement reflects an ageing population (Jones, 2010, p. 6). Institutions can also reverse it for decades; US inventors have got younger since the late 1990s (Jung & Ejermo, 2014; Kaltenberg et al., 2023). Details are in S6. ↩
-
The median US time from a bachelor's degree to a PhD in the physical sciences was 6 years in 1936 and 6.7 in 2024 (Tuckman et al., 1989, p. 507; Science & Statistics, 2025, Table 1-12). ↩
-
Two more. The wait between a product's launch and a rush of competitors fell from about 23 years before 1930 to about 5 after 1940 (Gort & Klepper, 1982, p. 640). The average gap between an enabling tool and the major discovery made with it fell from 30 years in the 1800s to 6 in 2000–22 (Krauss, 2026, p. 7), though recent figures flatter, because recent discoveries are still being recognised. ↩