35 Figures on the Decline of Relationships and the Rise of Technology
Less time together, less sex, and what arrived in the same years.
Technology is competing for our attention, and it is winning.
Attention is also zero-sum. There is only so much time to give in a day.
This means, simply, that friends and family once took up more of our time and are now losing a battle against technology. Each minute spent on the TV, then the internet, then smartphones and then social media takes away from the time we'd spend with others.
I believe that capturing our attention is a data problem. As I showed in my previous post, the progress of a technology is proportional to the log of the information put into it. This is true not just in machine learning and AI, but across dozens of industries.
Over the past decade, the volume of data tech companies receive has been increasing exponentially. Data is their priority: if they can improve their algorithms to capture your attention, they can sell more of it. As a result, the algorithms have improved incrementally and continuously. We now spend more time than ever on tech.
At the same time, we are on the eve of the singularity. Superintelligence is near. It has the ability to accelerate technology enormously, decades in years. During this period, if humanity survives, I expect entertainment will evolve commensurately.
Hyperentertainment will emerge: algorithms exquisitely and superintelligently designed to satiate our senses. Since our attention is finite, I expect human relationships will largely begin to cease.
I've had AI scrape, collect and plot the following data, which I believe supports this thesis in aggregate.
Thank you for your attention.
People spend less time together
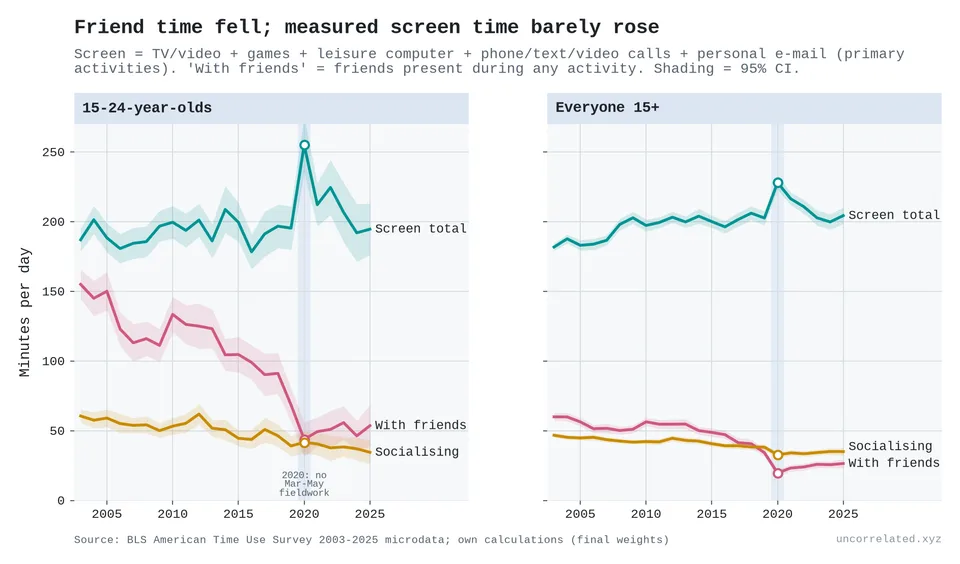
1. Americans aged 15–24 spent 150 minutes a day with friends in 2003–05 and 52 in 2023–25. From the American Time Use Survey, which asks people to account for every minute of one day [our analysis].
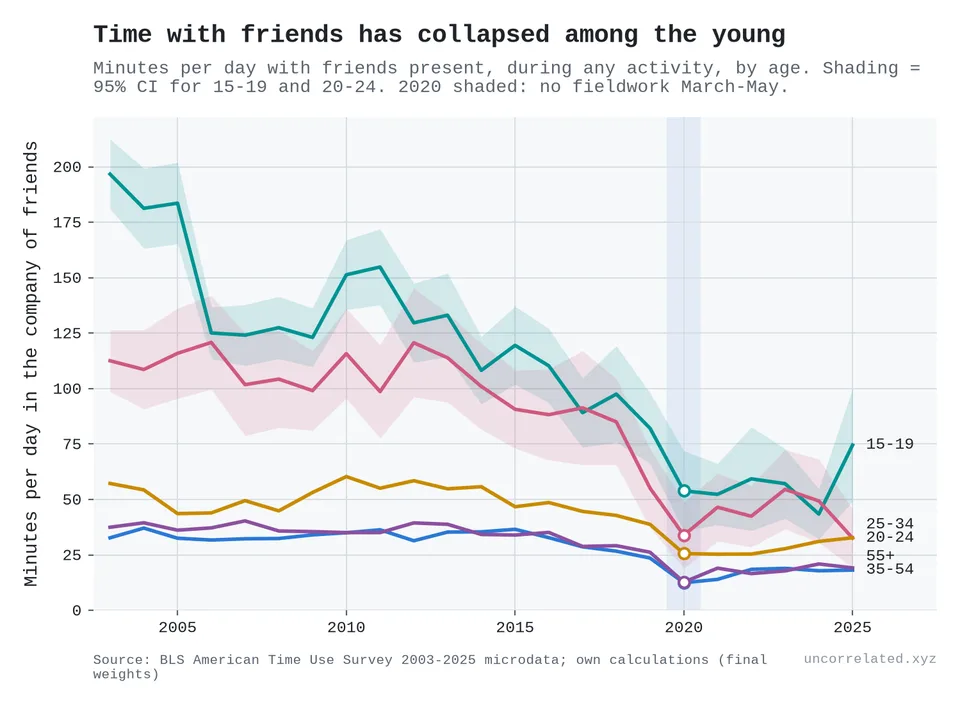
2. The same survey by age. Every age group lost time with friends, and teenagers lost the most [our analysis].
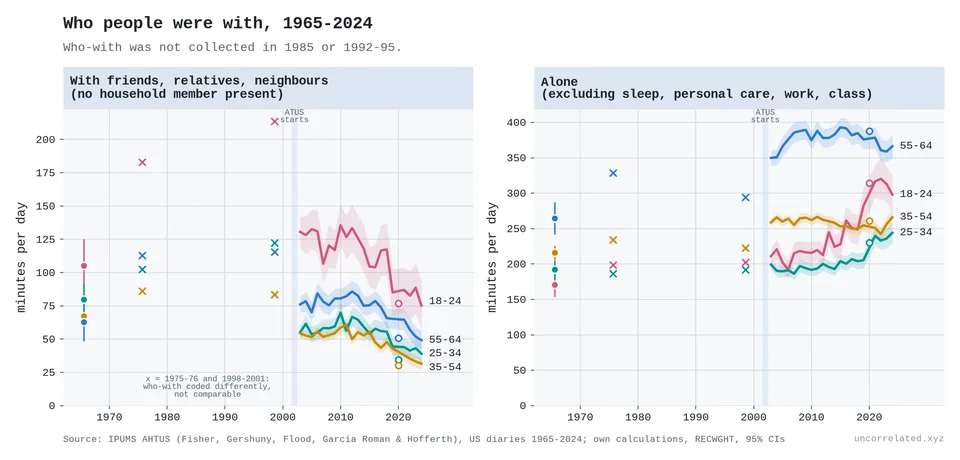
3. US diaries back to 1965: time with friends, relatives and neighbours on the left, time alone on the right. Among 18–24-year-olds, time alone climbs after 2012 (our analysis of Fisher et al., 2018).
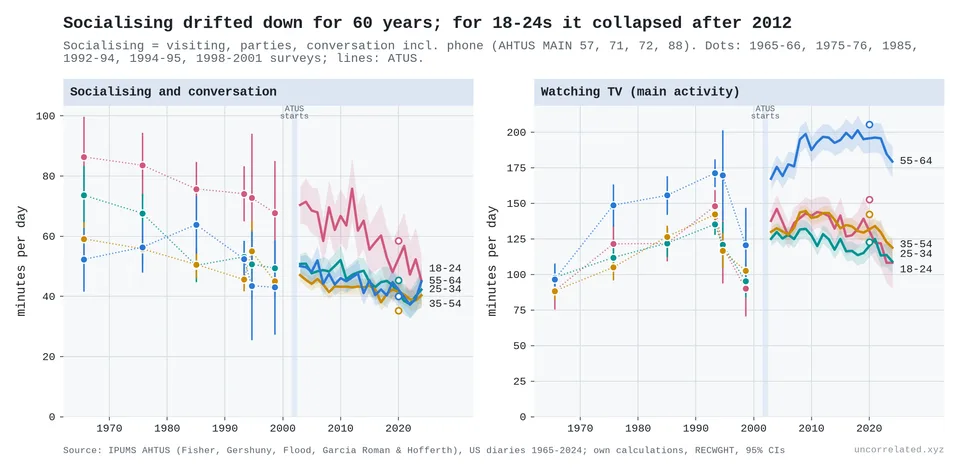
4. Socialising as a main activity, and television, over the same sixty years. Taking 19–64-year-olds together, socialising fell from 66 minutes a day in 1965–66 to 41 in 2022–24, about 5 minutes a decade (our analysis of Fisher et al., 2018).
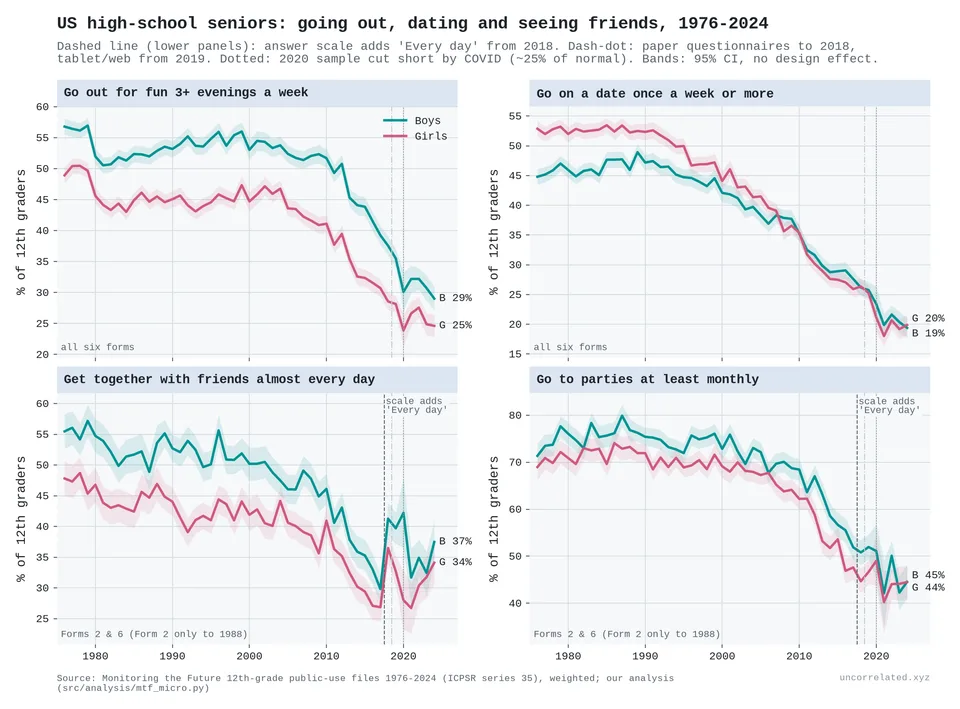
5. US high-school seniors, boys and girls, 1976–2024: going out, dating, seeing friends and going to parties. Across both, the share going out three or more evenings a week was 53% in 1976, 45% in 2012 and 27% in 2024, the last on a web survey not strictly comparable with the paper years (our analysis of Miech et al., 2025).
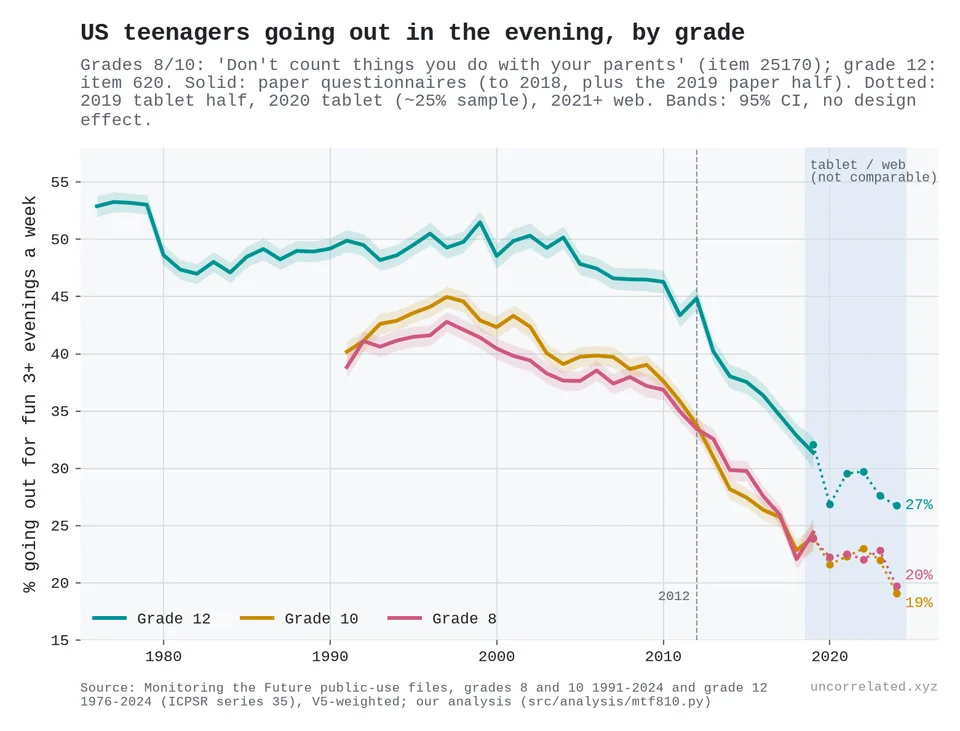
6. The same question for 8th, 10th and 12th graders. All three grades turn down together around 2009–10 (our analysis of Miech et al., 2025; Miech et al., 2025).
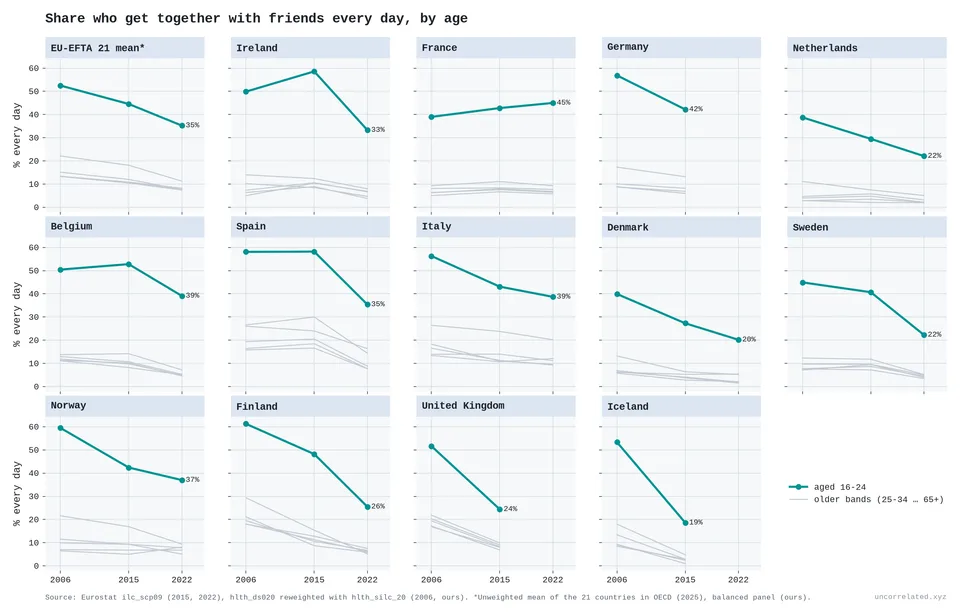
7. Europe: the share who get together with friends every day, by age, in 2006, 2015 and 2022. Among 16–24-year-olds it went from 52.5% to 35.2% (our analysis of EU-SILC; totals within a point of OECD, 2025).
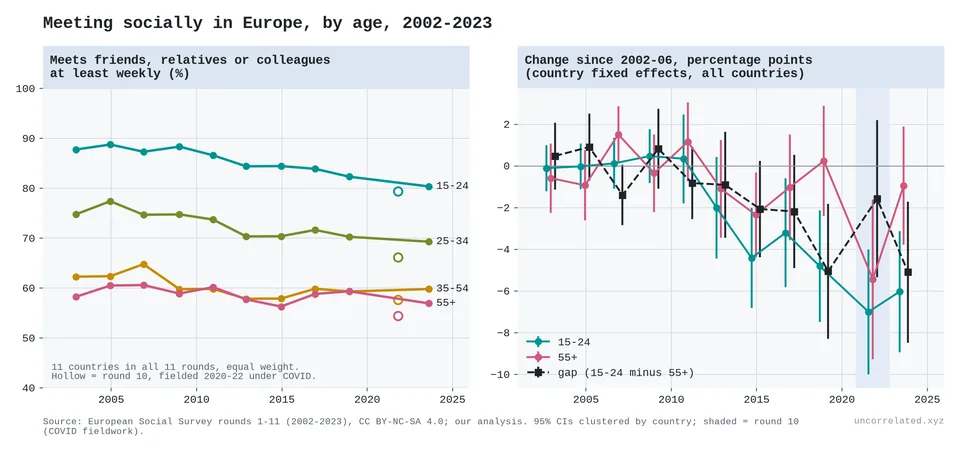
8. A second European survey, with the same question in eleven rounds from 2002 to 2023: meeting friends, relatives or colleagues at least weekly, by age (our analysis of ERIC), 2025).
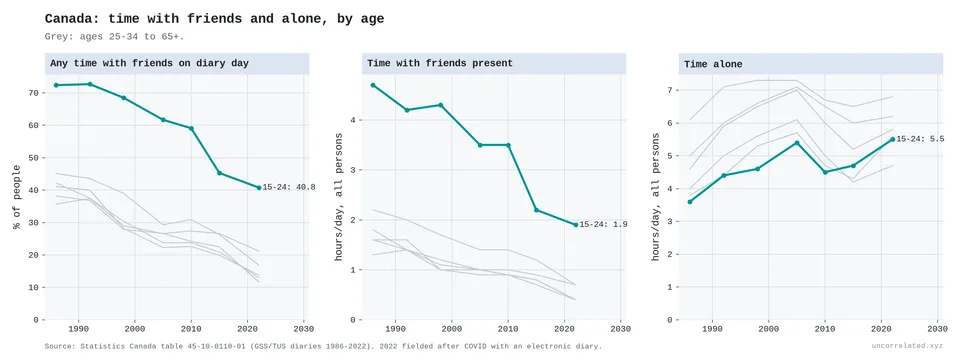
9. Canada, 1986–2022: the share of people who spent any time with friends on the day they kept a diary, and the hours they spent (Canada, 2025).
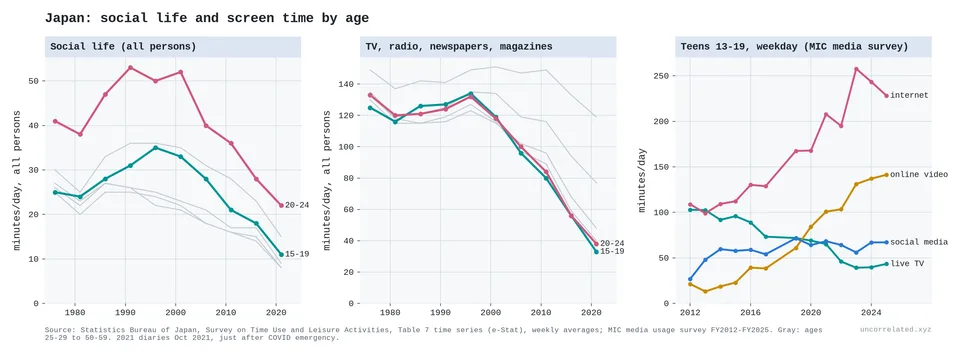
10. Japan: minutes of social life by age, 1976–2021, beside television and, for teenagers, media use to 2025 [our analysis of the Survey on Time Use and Leisure Activities and the MIC media diary].
11. The longest series we could find outside the US. Norwegian 16–24-year-olds' social time peaked at 147 minutes a day in 1980 and was 61 in 2022 [our analysis of national statistics offices, HBSC, EU-SILC and HETUS].
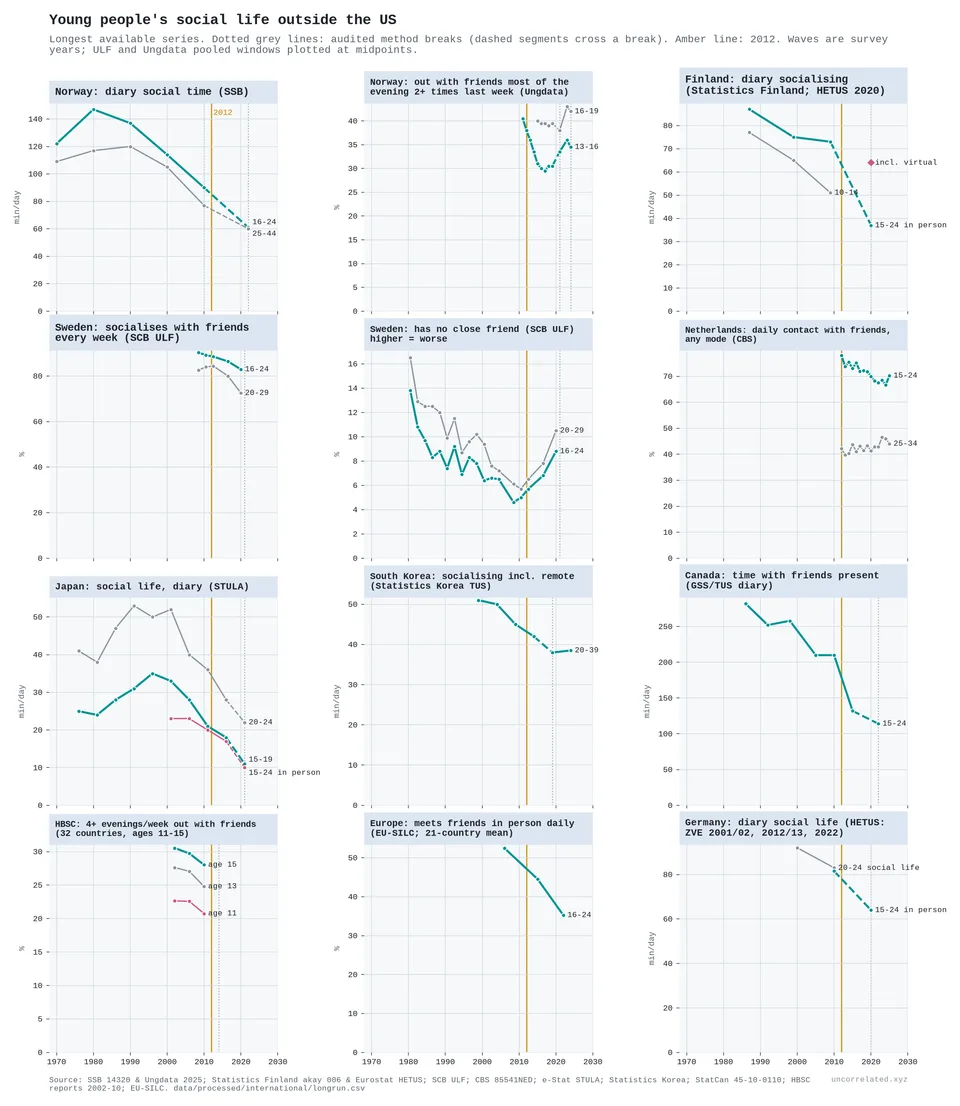
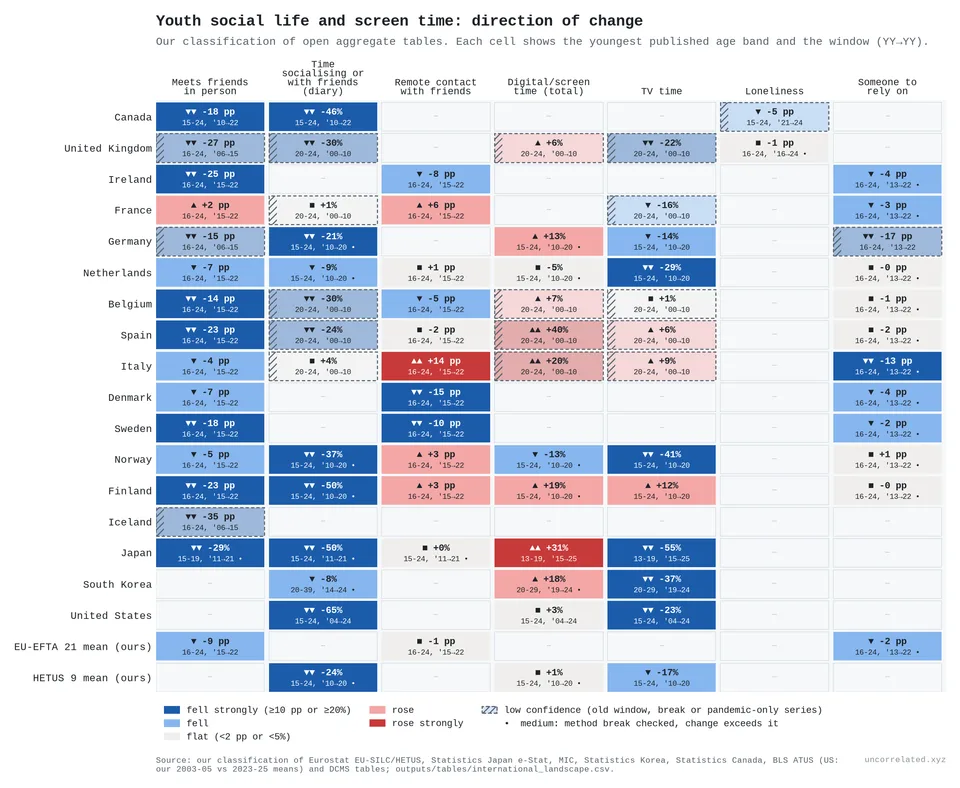
12. Every country and indicator we could assess, coloured by direction. Blue is a fall [our analysis].
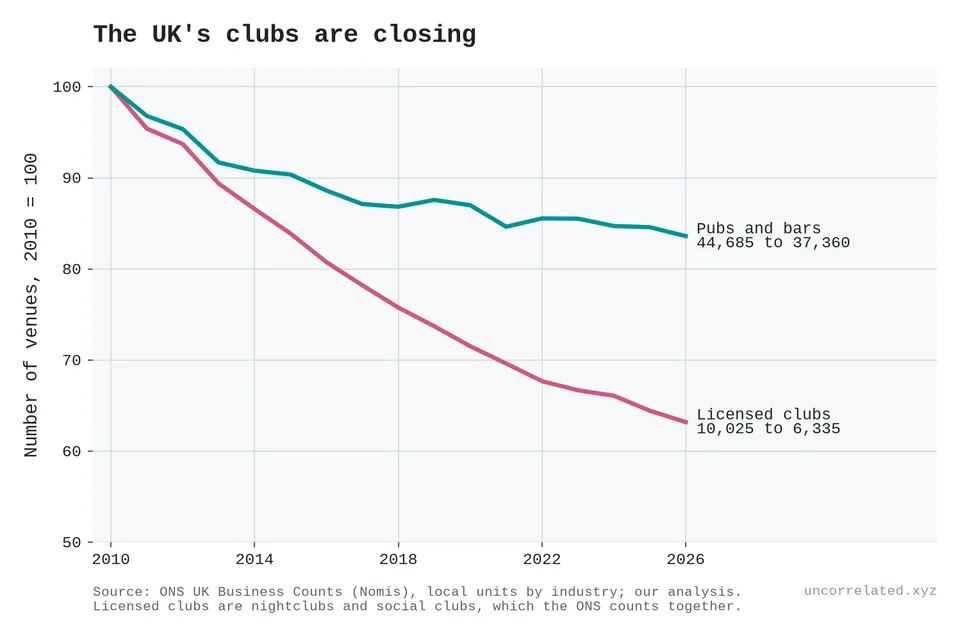
13. The UK's licensed clubs, which include nightclubs, fell from 10,025 in 2010 to 6,335 in 2026 (our analysis of Statistics, 2026).
They have less sex
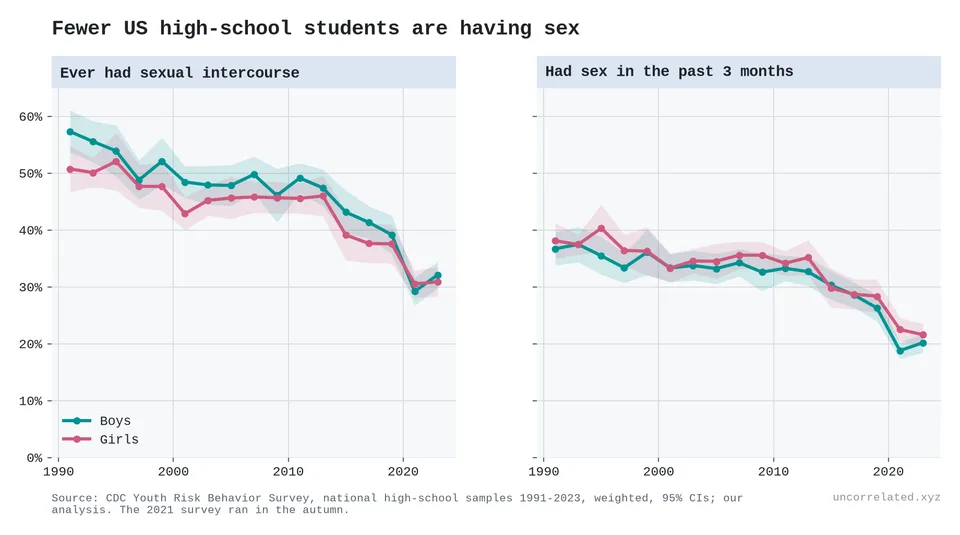
14. US high-school students who have ever had sex: 54% in 1991, 32% in 2023 [our analysis of the CDC Youth Risk Behavior Survey].
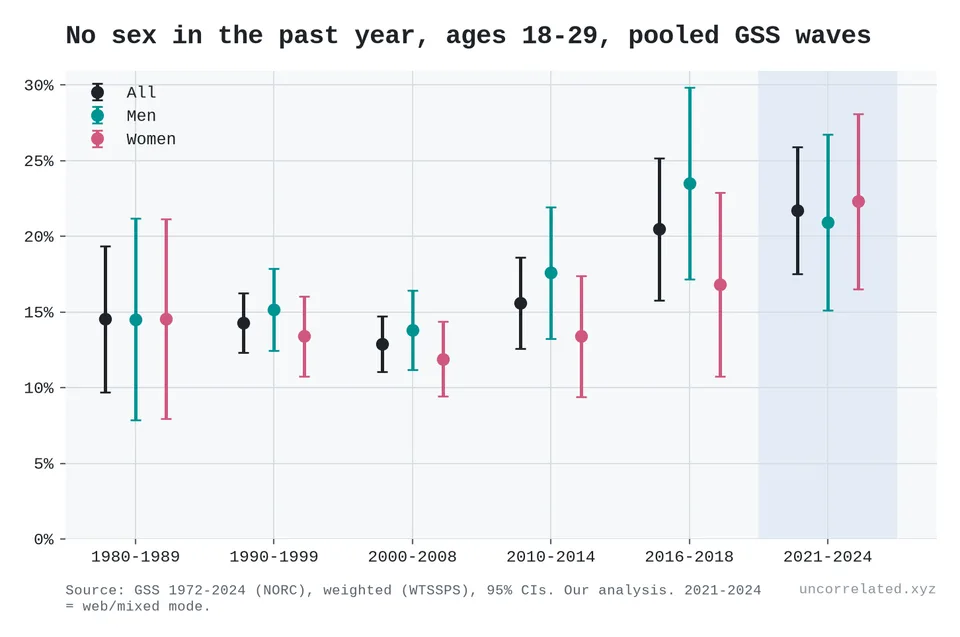
15. Americans aged 18–29 reporting no sex in the past year: 13% in 2000–08, 22% in 2021–24 [our analysis of the General Social Survey].
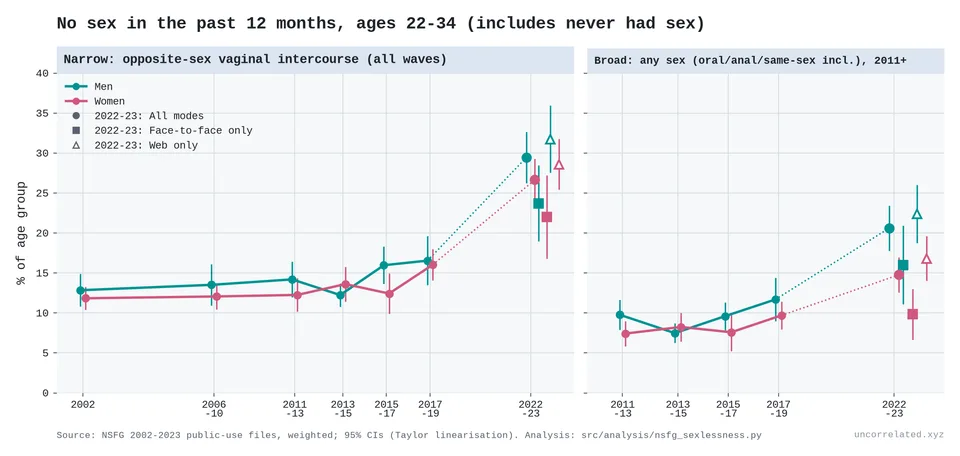
16. The same measure for ages 22–34 in a larger survey, the National Survey of Family Growth, with the 2022–23 wave split by how people were interviewed [our analysis].
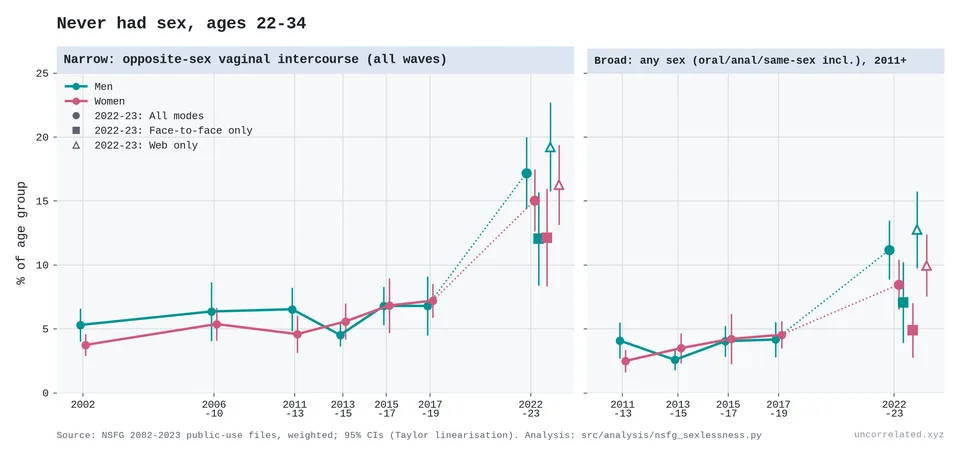
17. Never had sex, ages 22–34. On the survey's long-running definition, and in face-to-face interviews only, it went from about 7% in 2017–19 to about 12% in 2022–23 [our analysis of the NSFG].
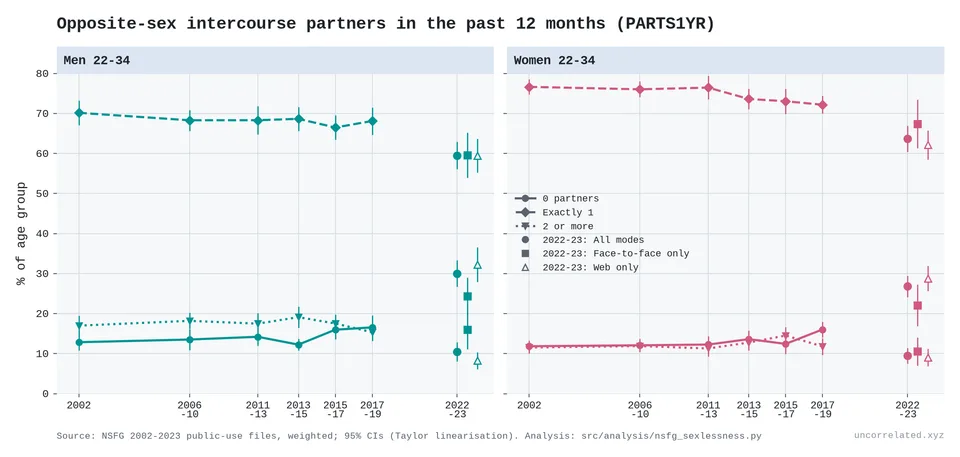
18. Number of partners in the past year, ages 22–34. More people have none and fewer have exactly one [our analysis of the NSFG].
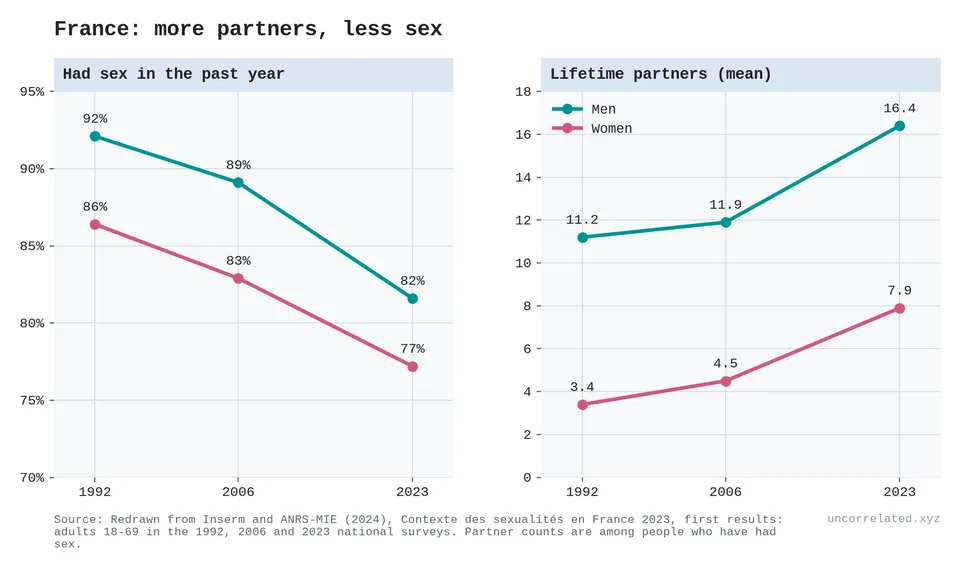
19. France, 1992–2023: fewer adults had sex in the past year while lifetime partner counts rose (redrawn from ANRS-MIE, 2024).
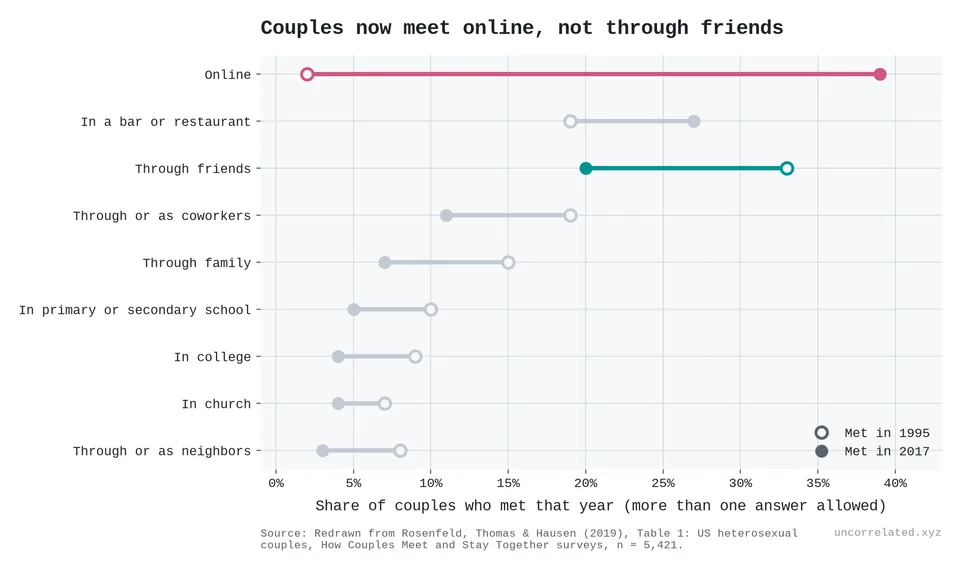
20. How US heterosexual couples met. Of those who met in 1995, 2% met online and 33% through friends; of those who met in 2017, 39% and 20% (redrawn from Rosenfeld et al., 2019).
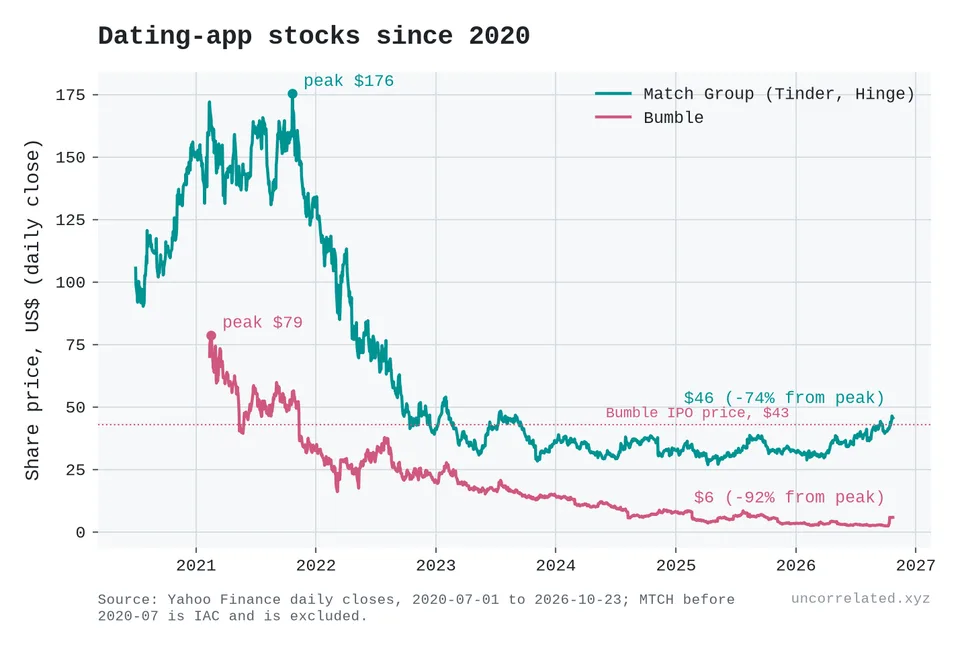
21. The companies that own the dating apps. Match Group's share price is down 74% from its 2021 peak [Yahoo Finance daily closes; our analysis].
Each new screen arrived faster
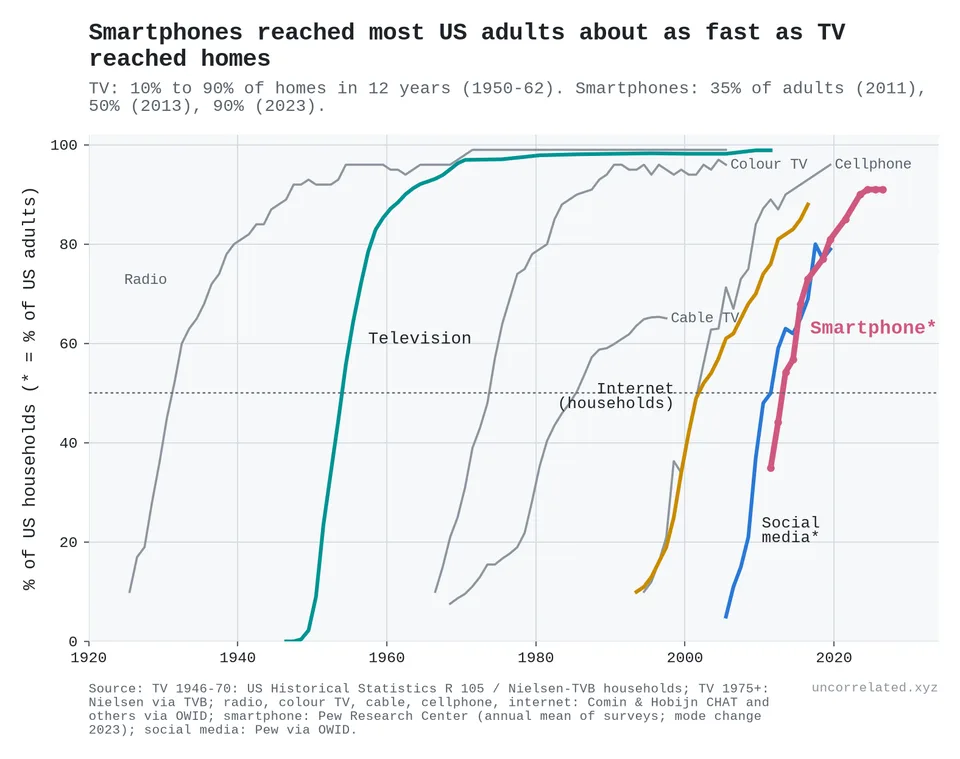
22. A century of new media in US homes: radio, television, colour, cable, the internet, the mobile phone, social media, the smartphone (Census, 1975; Advertising, 2011; Pew Research Center; Our World in Data).
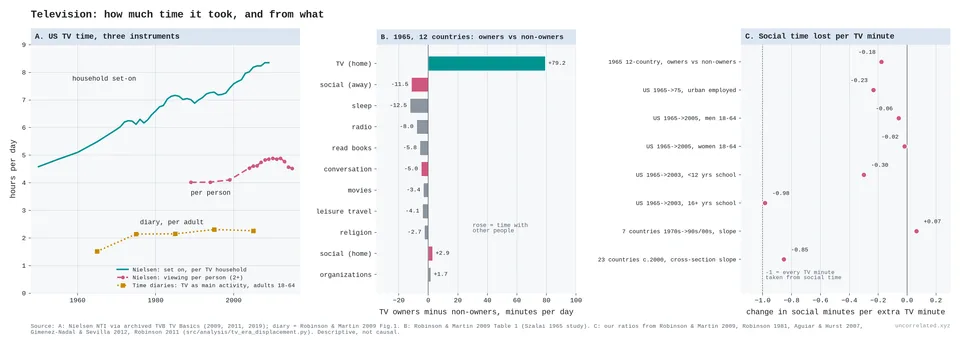
23. Television. The average US TV household had its set on for 4 hours 35 minutes a day in 1950 and 8 hours 21 minutes in 2009. In a 1965 diary study across twelve countries, people who owned a set watched about an hour and a quarter more a day than people who didn't, and spent 14 fewer minutes with other people (Advertising, 2011; Robinson & Martin, 2009; our analysis).
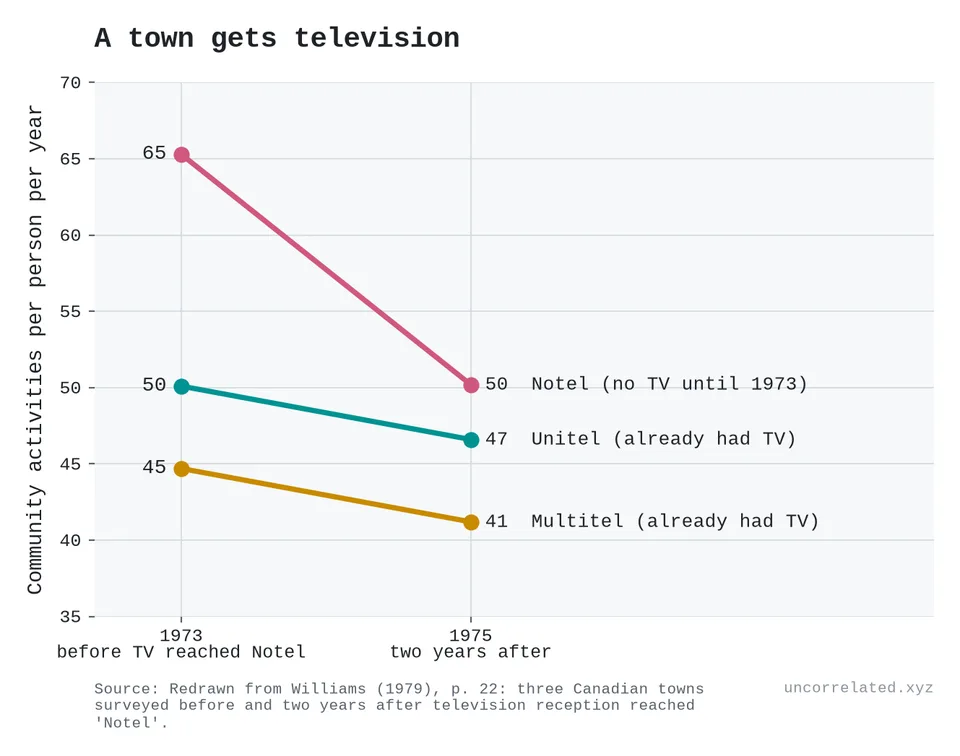
24. A Canadian town, called Notel by the researchers, got television reception in 1973. Its community life fell towards the level of two towns that already had it (redrawn from Williams, 1979).
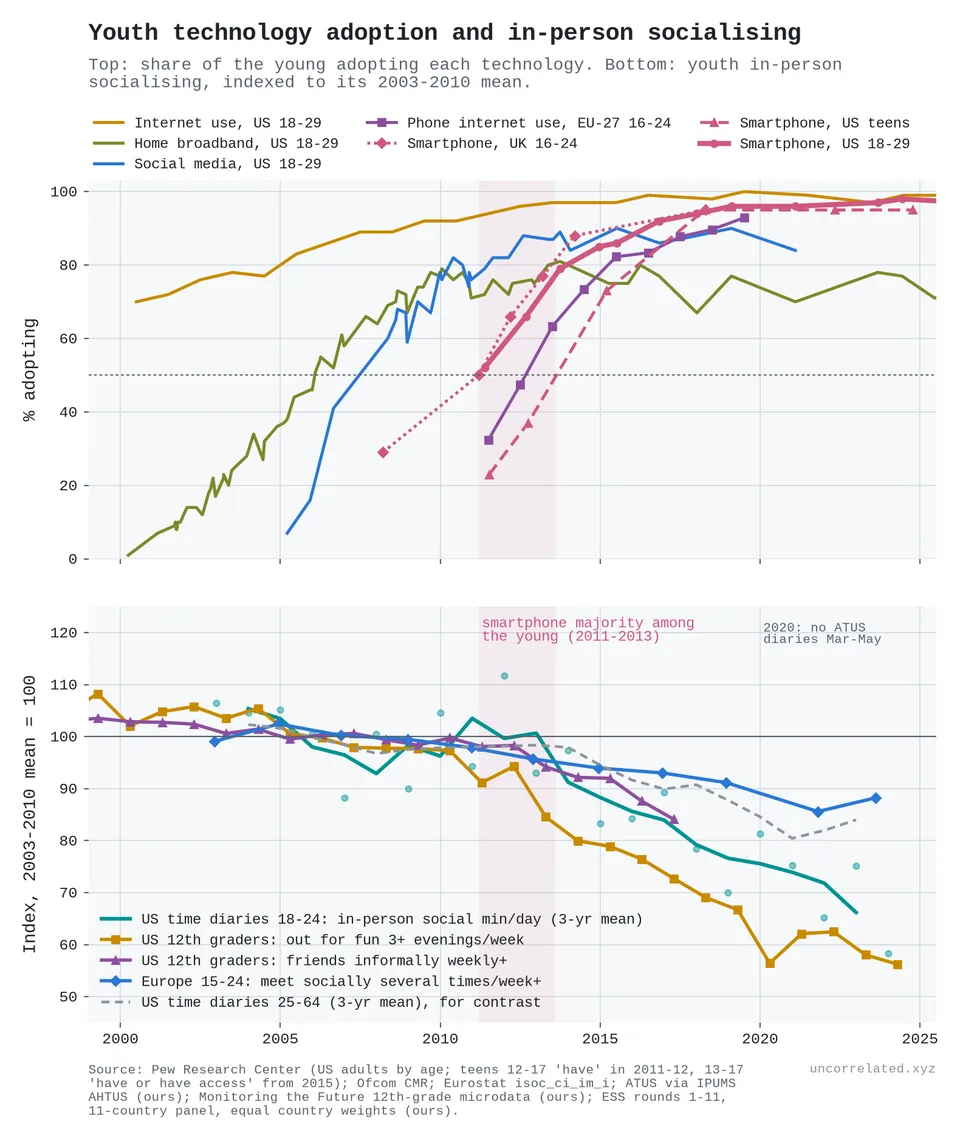
25. Top: when each technology reached young people. Bottom: their in-person socialising. 52% of US 18–29-year-olds owned a smartphone in spring 2011 and 92% by late 2016 (Smith, 2011; Center, 2017; our analysis).
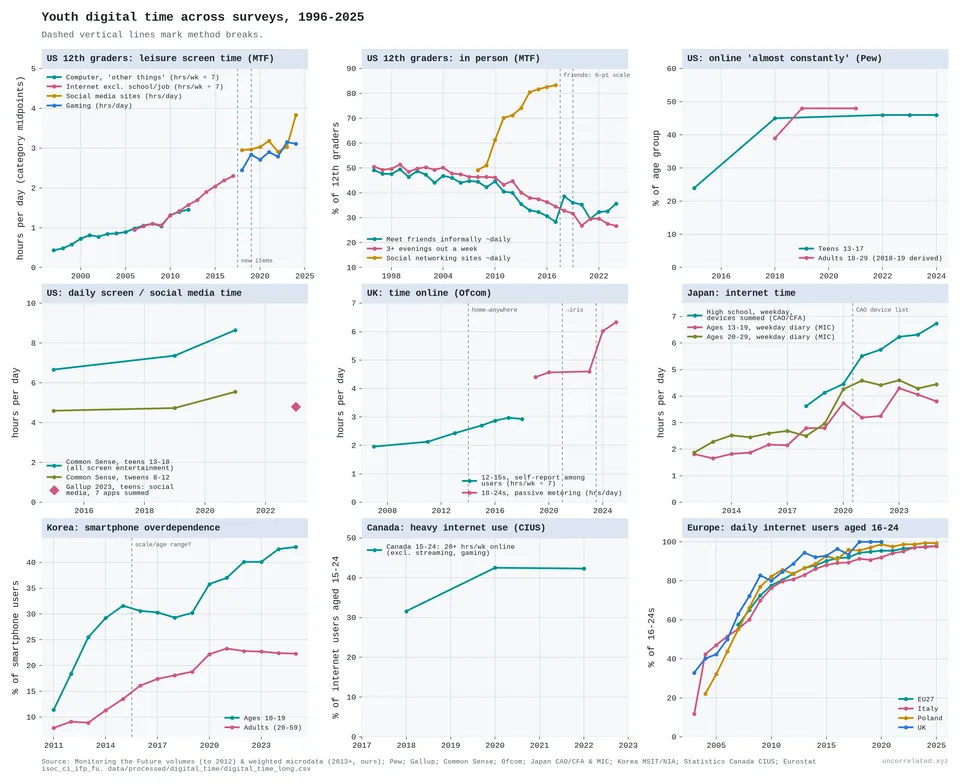
26. Every survey we could find that asks young people how long, or how often, they are online, 1996–2025 [our analysis; sources in the figure].
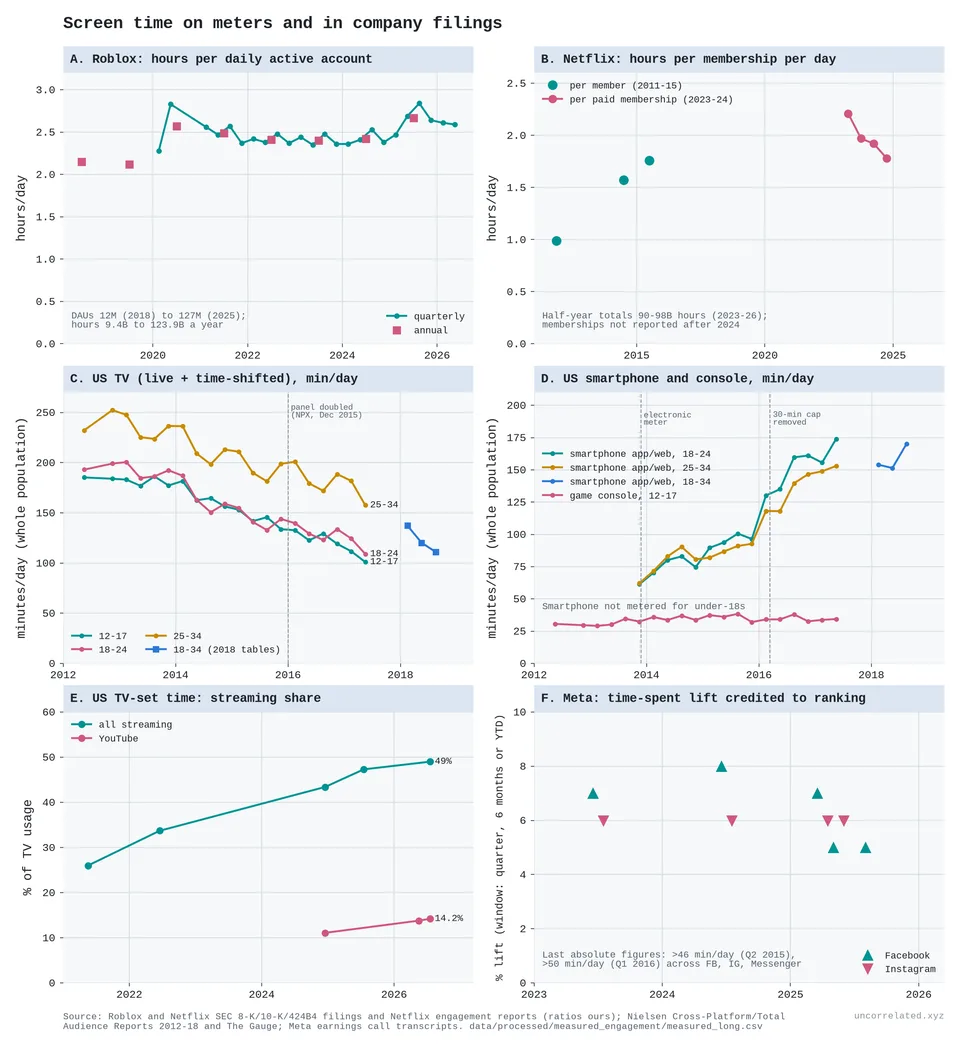
27. Time measured by meters and company logs instead of surveys. On Nielsen's meters, US 18–24-year-olds' television fell from 193 to 109 minutes a day between 2012 and 2017, and their smartphone time rose from 61 minutes in late 2013 to 174, partly through changes in how Nielsen counted it (Company, 2012; Company, 2014; Company, 2017; company filings).
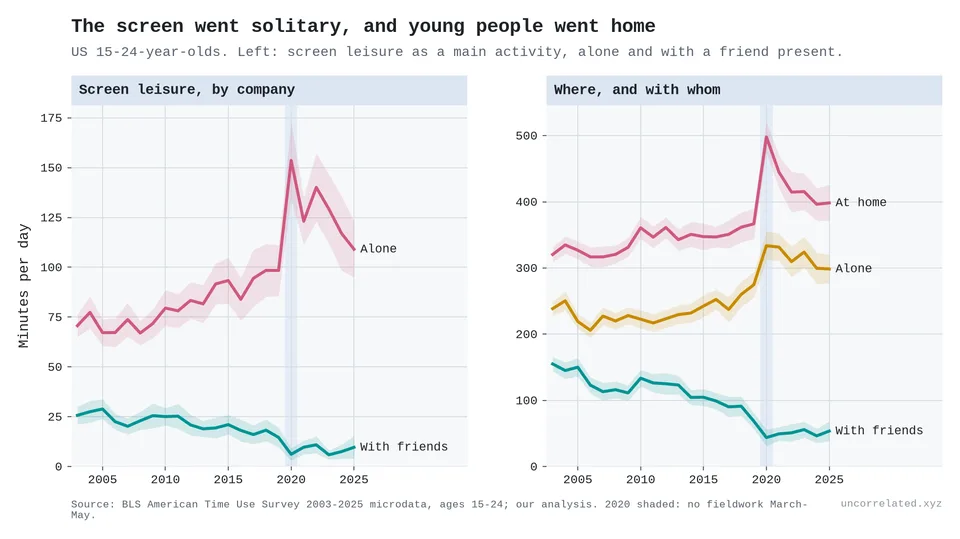
28. What changed is the company. Screen time with friends present fell from 27 to 8 minutes a day, screen time alone rose from 72 to 118, and time at home rose from 327 to 403 [our analysis of the American Time Use Survey, ages 15–24, 2003–05 to 2023–25].
The feed is built to hold attention
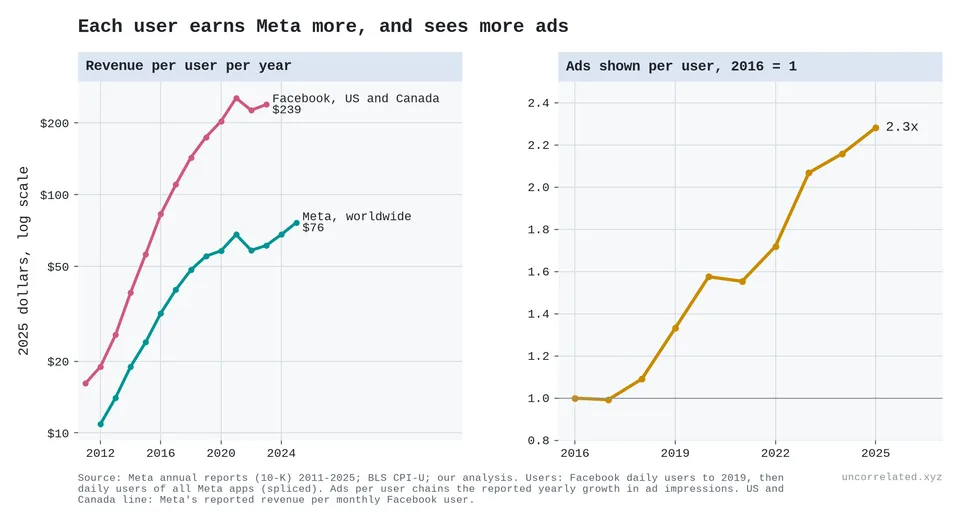
29. What a user is worth. Meta shows each user about 2.3 times as many ads as it did in 2016 (our analysis of Meta Platforms, 2026).
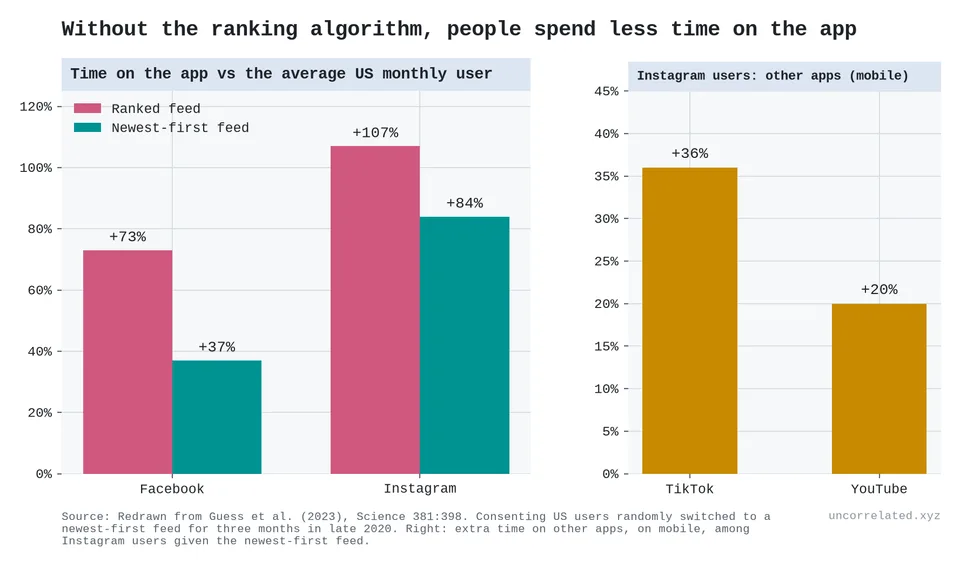
30. In 2020, Meta let researchers switch randomly chosen US users to a newest-first feed for three months. They spent less time on Facebook and Instagram, and the Instagram users among them spent more time on TikTok and YouTube on their phones (redrawn from Guess et al., 2023).
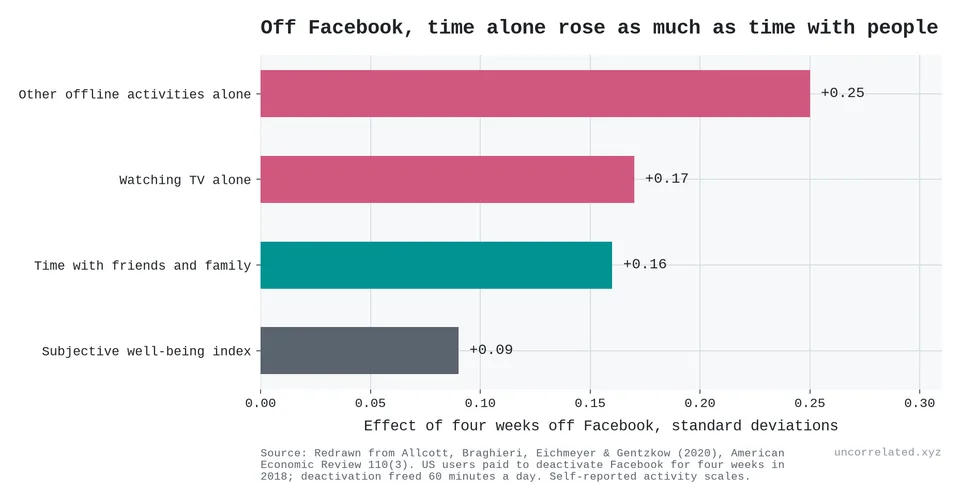
31. People paid to leave Facebook for four weeks got back an hour a day. Television alone and other solitary activities rose at least as much as time with friends and family (redrawn from Allcott et al., 2020).
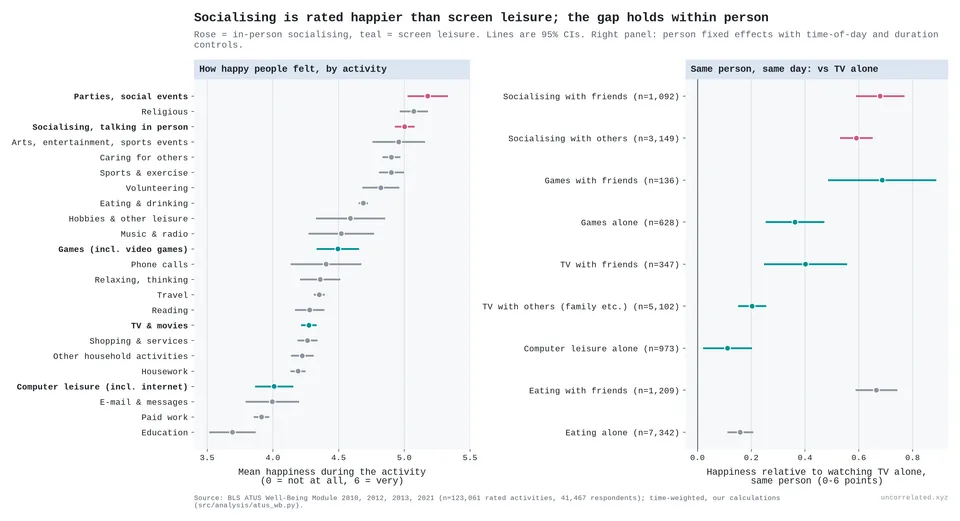
32. How happy Americans say they feel during each activity. Socialising averages 5.0 out of 6, television 4.3 and leisure on a computer 4.0 (our analysis of Statistics, 2022).
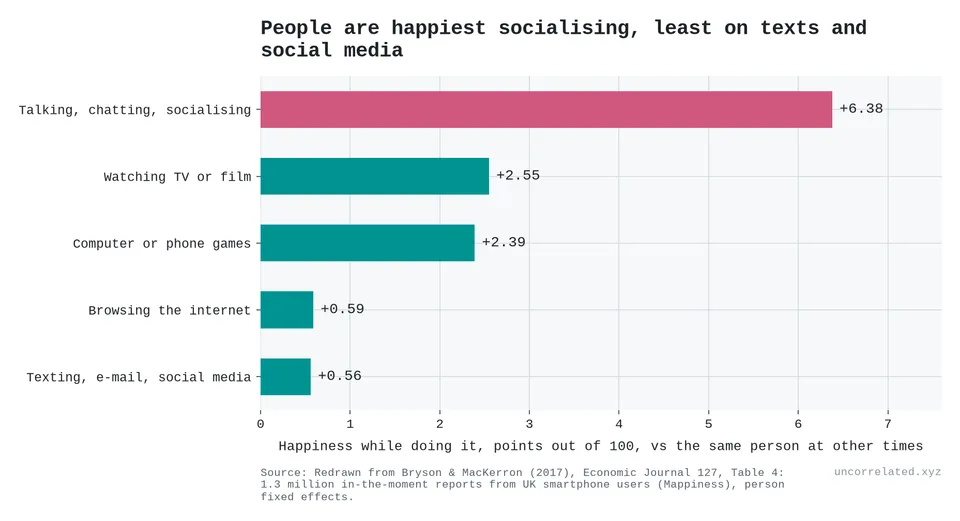
33. A similar question asked in the moment, by phone, 1.3 million times in the UK (redrawn from Bryson & MacKerron, 2017).
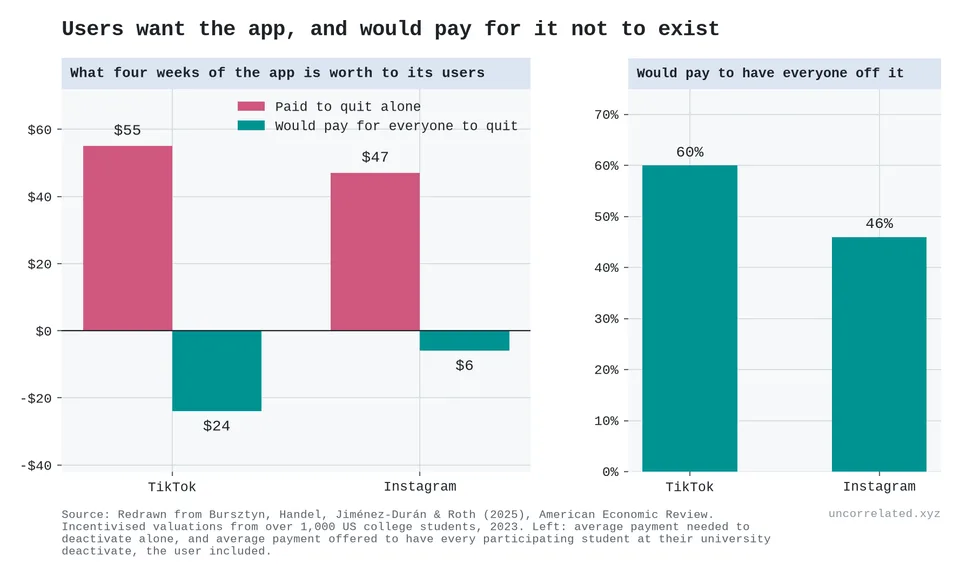
34. US college students needed $55 to give up TikTok for four weeks while everyone else stayed on. 60% of them would pay to have every participating student at their university, themselves included, taken off it (redrawn from Bursztyn et al., 2025).
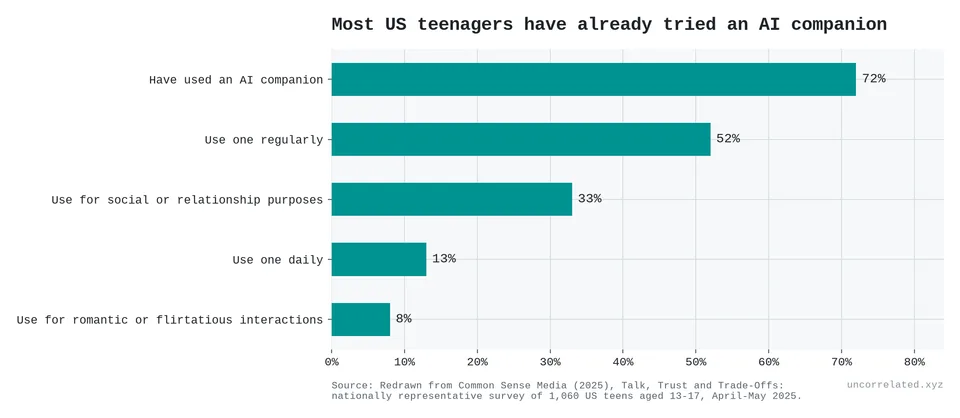
35. The next screen. 72% of US teenagers have used an AI companion and 52% use one regularly (redrawn from Robb & Mann, 2025).