Table of Contents
TL;DR
-
We trained a multinomial logistic regression model (k = 18, n = 1.5 million) using racial probability classes extracted from DeepFace’s racial classifier and first and last name racial summary statistics from the US census and Rosenman et al. (2023), achieving 92.76% accuracy in three-race classification (Black, White, Hispanic).
-
A sufficiently accurate linear model trained on biased data learns the true signal from noise. Systematic deviations indicate mislabeling by authorities rather than model error.
-
29% of individuals predicted to be Hispanic were officially classified as White by Department of Corrections authorities.
-
This pattern persisted at high model confidence (95-100%), where 22.4% of predicted Hispanics were still assigned as White.
-
Correcting for misclassification increases Hispanic criminal record rates by 31%, decreases White rates by 6%, and decreases Black rates by 1%.
-
Bias between other racial pairings was minimal and symmetrical (equal numbers of Blacks misclassified as White and vice versa).
-
State-level analysis showed no correlation with political ideology (r = 0.21, 95% CI: -0.36 to 0.67, p = 0.472), indicating random administrative error rather than deliberate bias.
-
The proportion of predicted Hispanics assigned White (r = -0.80, 95% CI: -0.95 to -0.38, p = 0.003, n=11) and the proportion of predicted Whites assigned Hispanic both correlated with Native American ancestry among Latinos (r = 0.74, 95% CI: 0.26 to 0.93, p = 0.009, n=11).
Introduction
Every so often on X a viral post emerges showcasing how non-white races are being systemically misclassified as White.
The implication is that it never occurs the other way around and therefore must be malicious, a phenomenon of anti-white racism (Last, 2020) to cook the books in favor of non-whites, an attempt at reverse racism to hide that pesky 13/52.
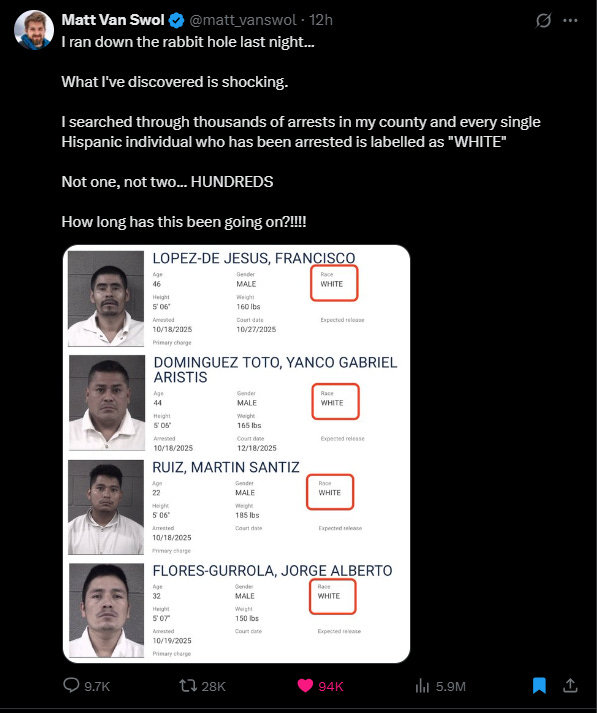
It’s popular enough now that various anons have spawned numerous similarly viral collages. Here’s a small, roughly sewn compilation:
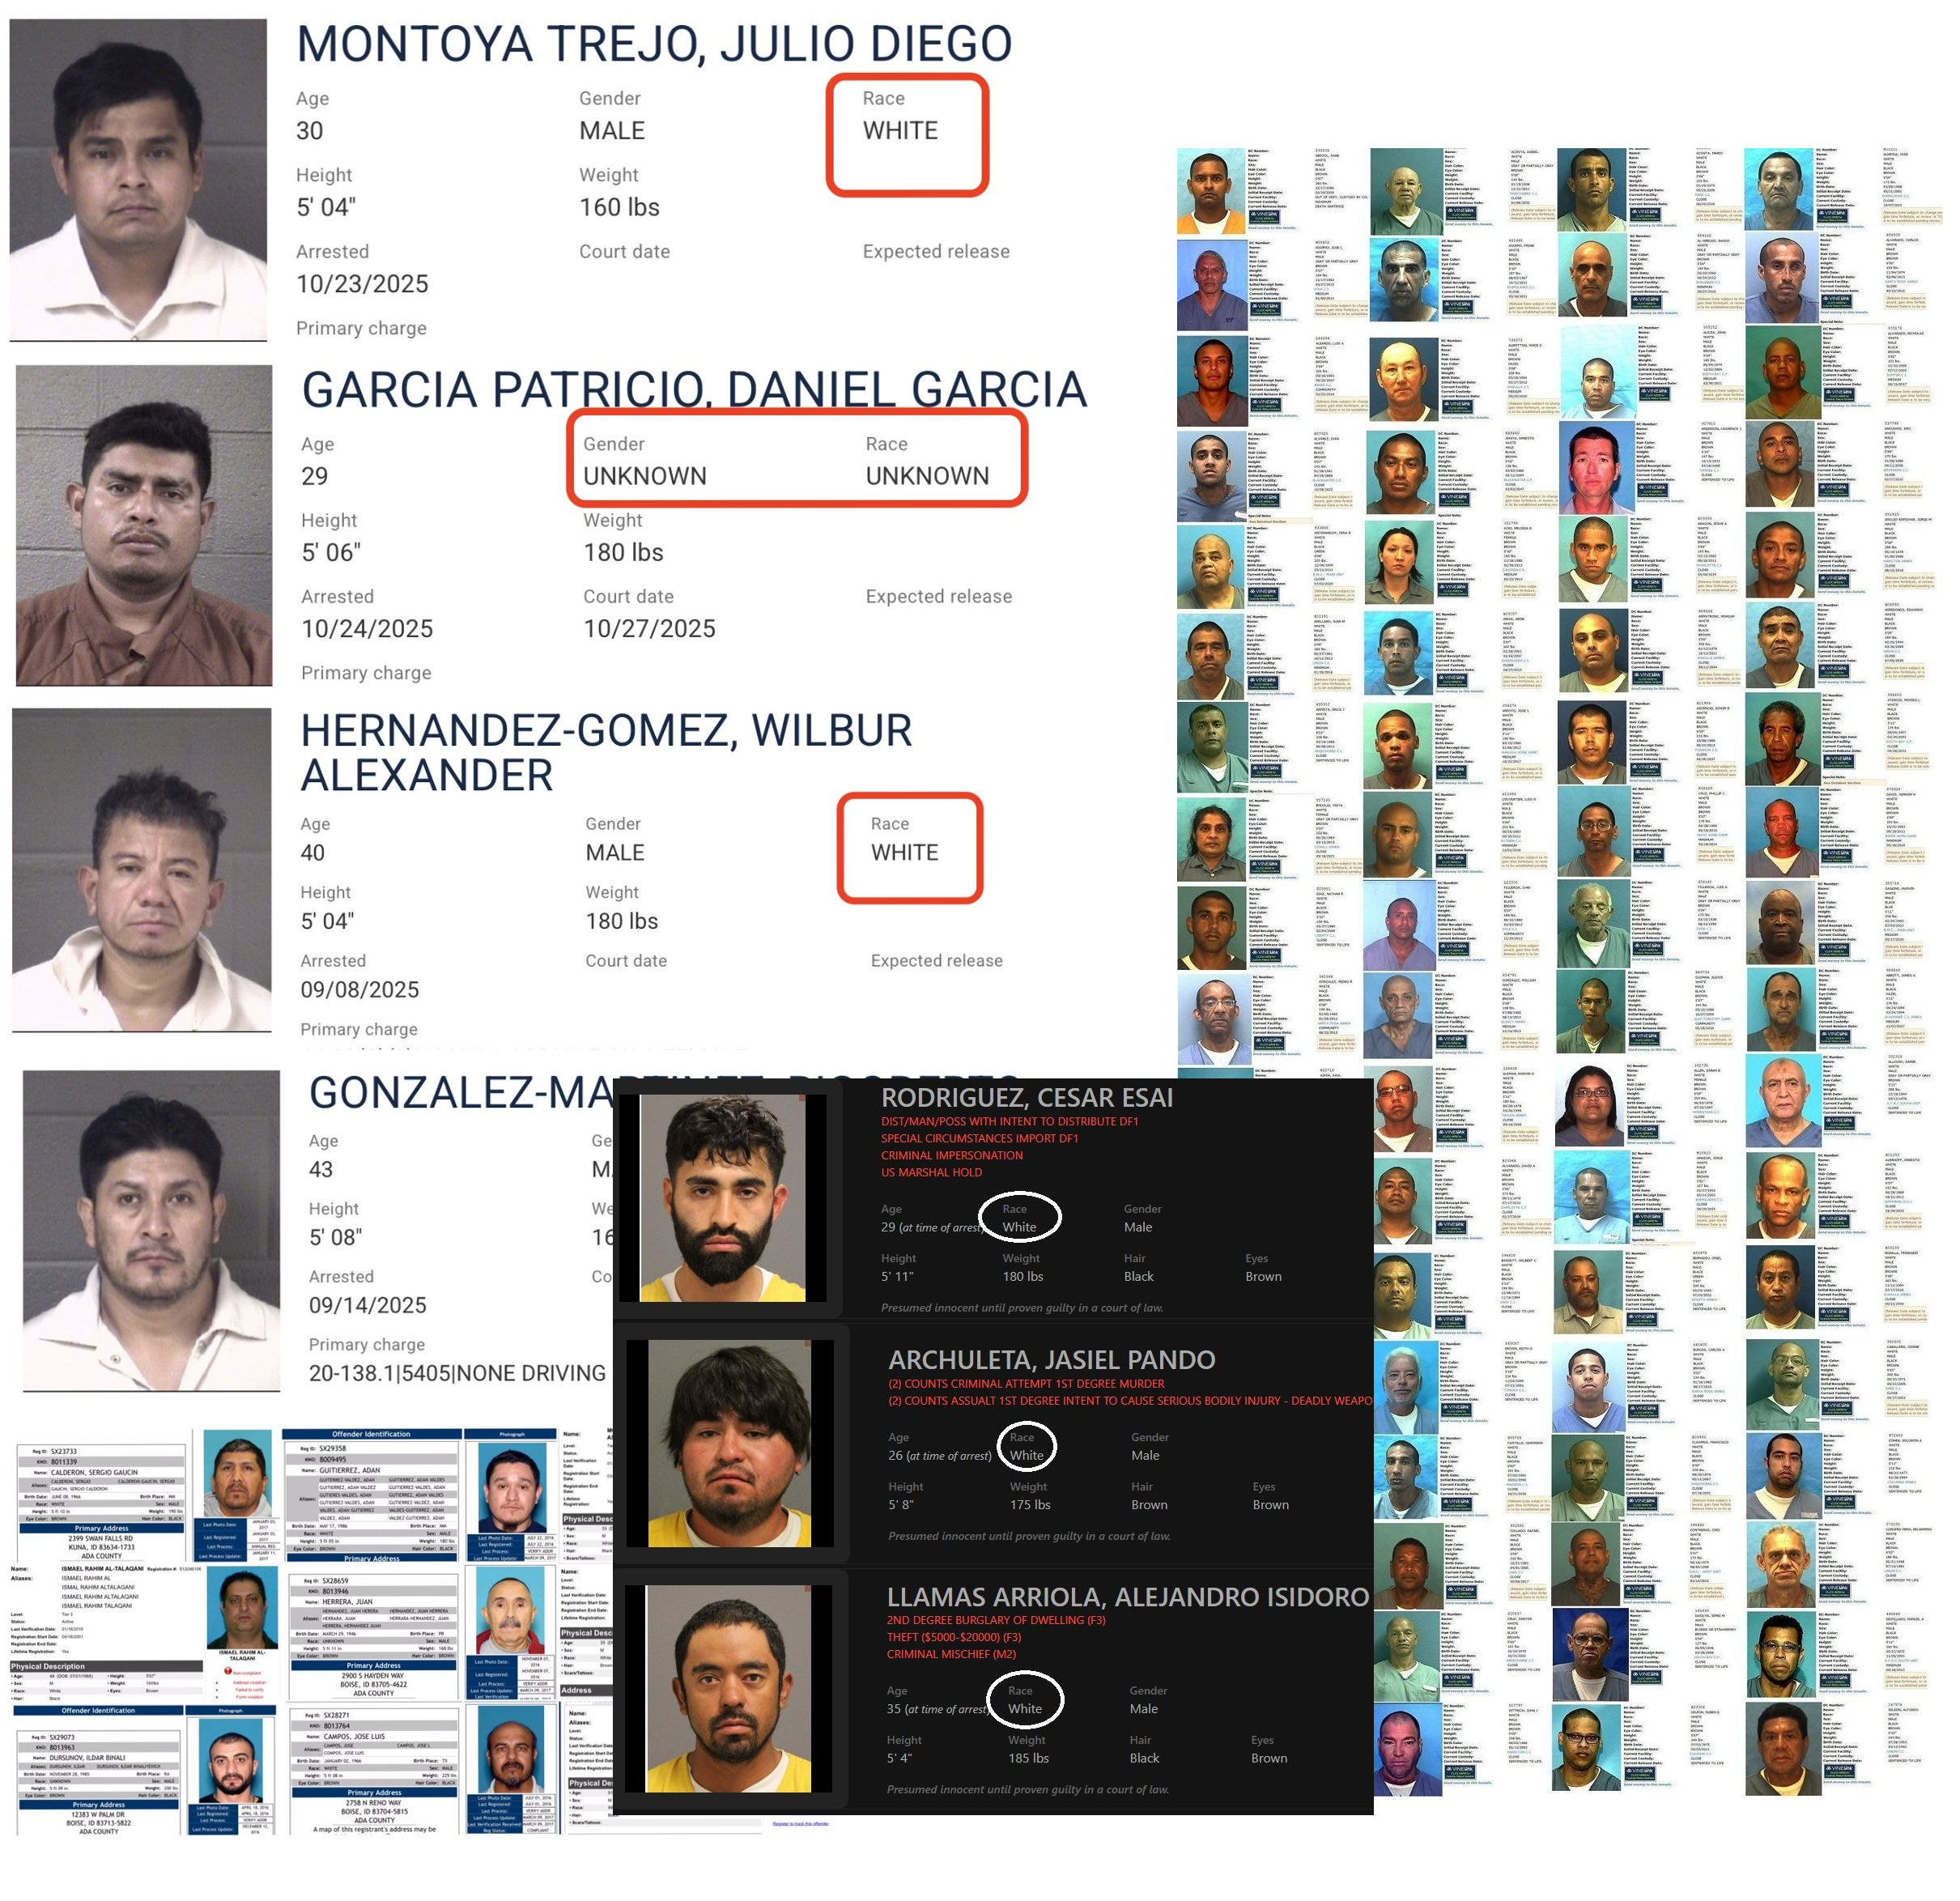
However, these accounts have issues that trigger skepticism among those who wouldn’t like finding out that non-white groups are more criminal than catalogued, and ambiguity for those inclined to accept the premise:
-
You have to trust the compiler doesn’t have ideological (right-wing) bias subtly pushing them towards cherry-picked cases.
-
Even ignoring 1, manual inspection has inherent issues. There’s variation in how someone classifies someone as White or not.
-
It’s anecdotal, limited to manual inspection. You have to trust that the n cases reviewed are representative, which is almost impossible to prove with this method.
There are likely more flaws than this. Everyone knows this isn’t evidence of systematic misclassification. Which is exactly the problem.
Luckily, we conducted extensive, systematic web-scraping of Department of Corrections (DOC) databases nearly a year ago, obtaining records for 5.5 million criminals from 39 U.S. states. After applying data quality requirements, our final dataset comprised 1.5 million criminal records with complete mugshot, demographic, and naming information.
We have the materials to answer this question definitively. Using statistical and modeling methods incorporating 21 variables derived from mugshots using facial recognition algorithms and names using demographic name databases (US census, Rosenman et al., 2023), we also have the means.
Is Bias Common?
Before we tackle the dataset and explain what we did, we must ask: is bias common in the criminal justice system?
This is important because if it is common and anti-white, finding bias in criminal racial classification would be unsurprising, or even suspicious if we didn’t find it.
On the other hand, if the criminal justice system is mostly color blind or genuinely pro-white, finding misclassification against Whites would be surprising.
So what does the literature say?
Racial bias has been studied across every stage of America’s criminal justice system, from initial police contact to final sentencing (Last, 2020). Experimental and observational studies spanning multiple domains with rigorous controls find either no racial bias against minorities or bias favoring minorities over Whites. Some prominent examples:
-
The first randomized controlled experiment on prosecutorial bias tested nationwide prosecutors with realistic case vignettes and found no statistically significant relationship between defendant race and charging decisions, with some analyses showing pro-black treatment (Robertson et al., 2019).
-
Experimental research using realistic deadly force simulators found officers were slower to shoot armed Black suspects than armed White suspects, and less likely to shoot unarmed Black suspects despite showing implicit bias (James et al., 2016).
-
The largest jury study ever conducted analyzed 300,000+ felony cases over 32 years and found no taste-based or statistical discrimination against Black defendants, with similar disparate impact when race was unknown to jurors (Hoekstra et al., 2023).
-
Comprehensive analysis of sentencing data across 43 U.S. states found either no racial bias in sentence length or bias favoring minorities, with studies consistently showing that legal factors (offense severity, criminal history) rather than race determine sentencing outcomes (Averages, 2023).
-
Race becomes unrelated to arrest probability after controlling for IQ, impulsivity, and criminal history in samples of 1,331 ex-convicts and other populations (Schwartz et al., 2019; Beaver et al., 2013).
-
Direct measurement using cameras found that the proportion of speeding drivers who were Black mirrored the proportion of Black drivers stopped by police (Lange et al., 2005).
-
Using the rate of attacks on police as a benchmark, Black Americans were 40% less likely to be shot by police than White Americans (Shjarback & Nix, 2019).
-
Multiple studies comparing arrest rates to incident reports found either no racial bias or pro-black bias in arrests, with consistent findings across 22 crime types (D’Alessio & Stolzenberg, 2003; Beck, 2021; Rubenstein, 2016).
-
Analysis using violent crime rates as a benchmark found White people over-represented among police killings, with no evidence of anti-black bias in most estimates (Cesario et al., 2019).
So generally there’s either no bias, or in occasional cases mild to moderate pro-black bias. We can establish that criminal misclassification bias against Whites is a possibility, despite explicit anti-white bias not being systematic in the literature.
Data
Quality and Quantity
Every US state maintains a Department of Corrections, and most operate a functioning website allowing public access to criminal records.
Using web scraping technologies, we collected complete databases from all 51 jurisdictions.
Our bias analysis required specific data elements from each state. We established minimum requirements for inclusion:
- Mugshots
- Racial classifications, with White, Hispanic and Black as distinct categories
- Complete names (first, middle, last) and suffixes
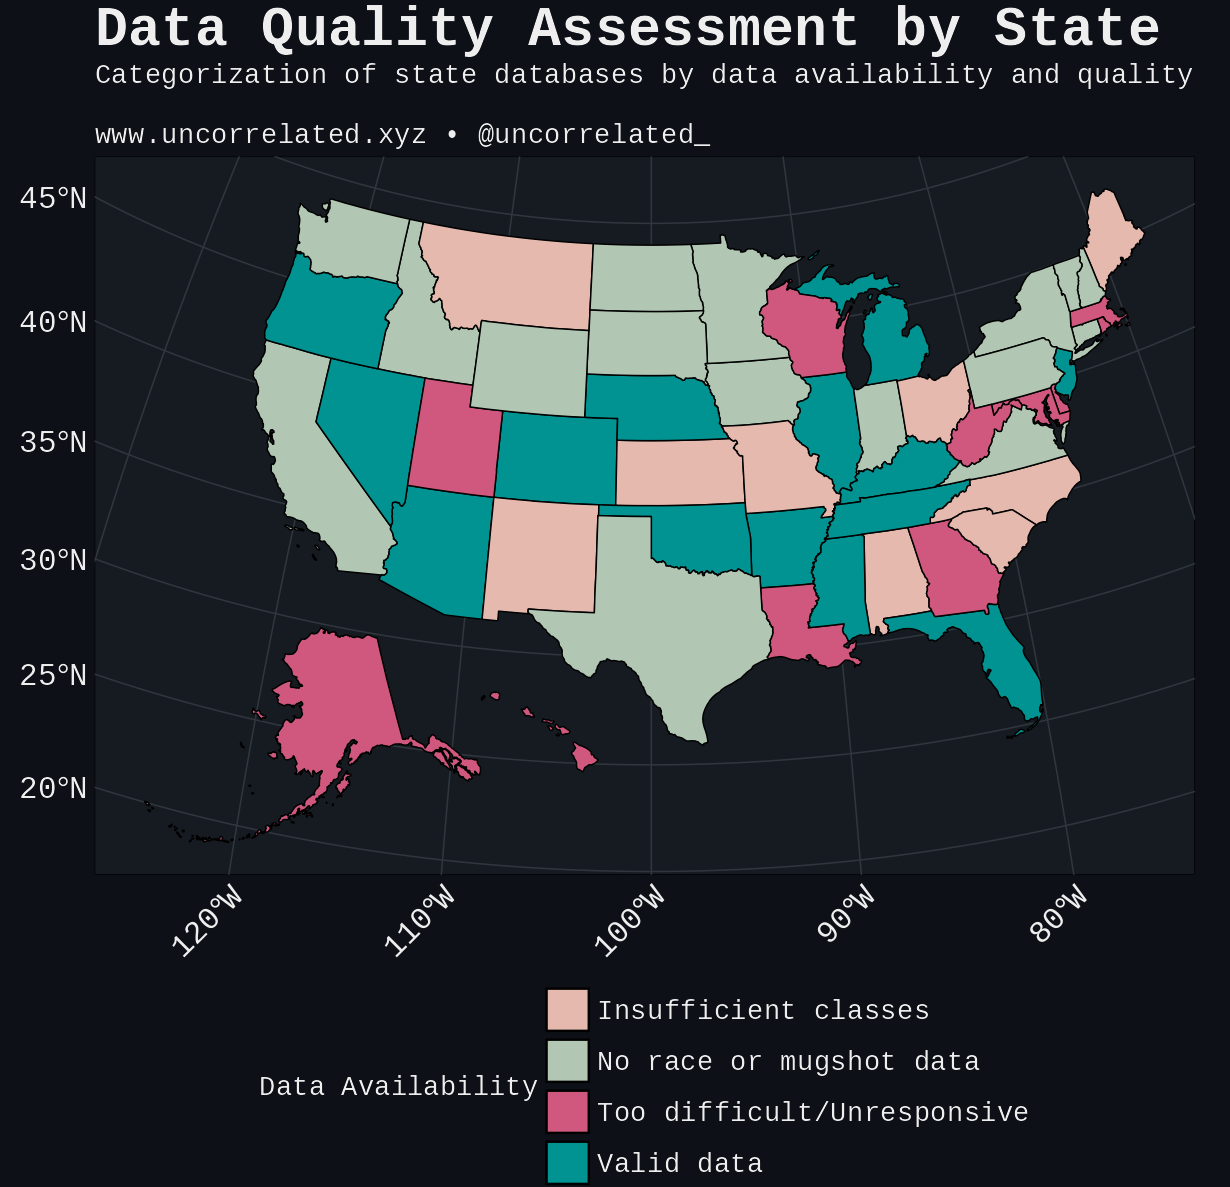
Point two is surprisingly restrictive. We excluded 16 states for lacking either race or mugshot data, and an additional 9 states for not recording Hispanic as a distinct racial category. Hispanic in the US isn’t considered a race but an ethnicity. As a result, some states opted out of classifying Hispanics entirely, instead classifying almost all Hispanics as White.
Since we’re interested in bias where race is consistently recorded, we removed states that didn’t explicitly and exclusively classify Hispanic as a category. A summary of the states scraped and exclusion criteria can be seen below.
Furthermore, data quality varied dramatically across states in terms of quantity, completeness, and accessibility.
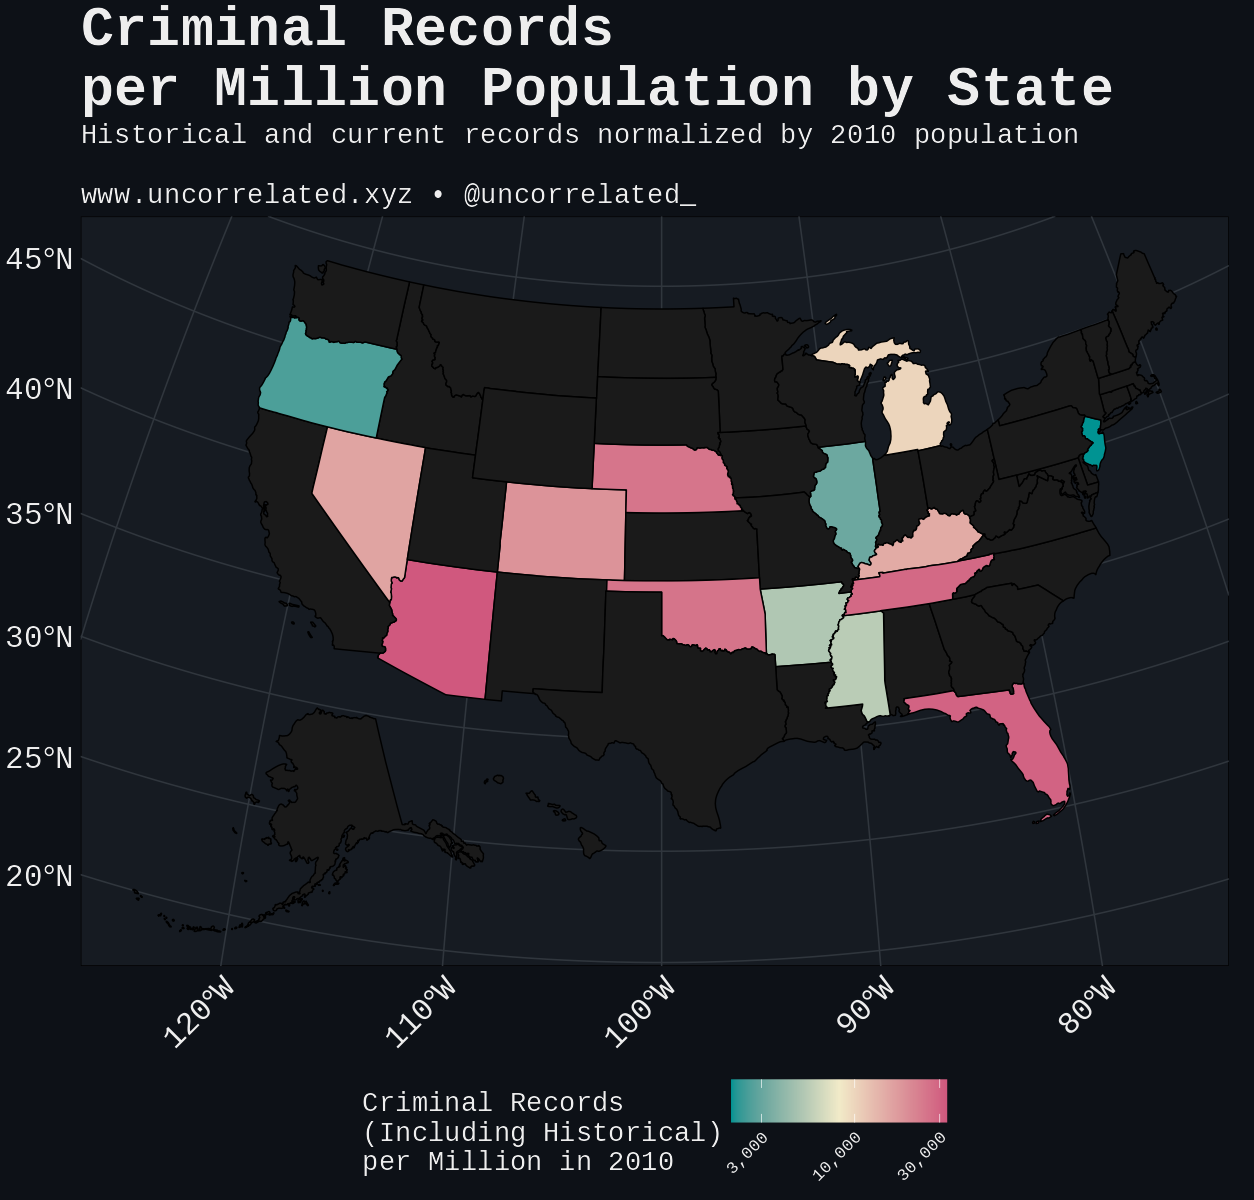
North Carolina exemplifies comprehensive data availability, allowing full database downloads with detailed records dating to the 1970s, yielding 1.2 million unique criminal records. In contrast, California, despite having four times North Carolina’s population and similar incarceration rates, produced nearly ten times fewer accessible records after scraping. The figure below shows the final representation of criminal records by state.
Race
We identified seven consistent racial classifications across our state datasets: Black, White, Hispanic, Asian or Pacific Islander, Native American, Multiracial, and “Unknown or Other”. While states used varying nomenclature (e.g., “hispanic or latin american”, “mexican american”, “mexican national” for Hispanic categories), we standardized these classifications for analysis. All qualifying states recorded Black, White, Hispanic, Asian or Pacific Islander, and Native American categories, with the sole exception of Florida, which did not assign Native American classifications.
Mugshots
We processed mugshots using DeepFace (Serengil & Ozpinar, 2024), a comprehensive facial recognition and classification framework. The system processes each image through facial detection, cropping, and alignment before applying neural network classifiers.
DeepFace’s internal model generates predictions across six racial categories: Asian, Indian, Black, White, Middle Eastern, and Latino Hispanic. These racial categories do not align perfectly with the classifications used by Departments of Corrections. We could not use this as an independent model for verifying our results. Instead, we incorporate these predictions as variables in our custom classification model rather than using DeepFace’s outputs directly.
Sex
Preliminary analysis showed that including sex as a predictor variable provided no significant improvement to our model. We excluded sex from subsequent models to maintain parsimony.
Names
We extracted complete name information (first, middle, last names, and suffixes) for each individual from Department of Corrections records.
To predict race from names, we utilized the comprehensive dataset from “Race and ethnicity data for first, middle, and surnames” (Rosenman et al., 2023), which provides racial breakdowns for each name segment across five categories: White, Black, Hispanic, Asian Pacific Islander, and “other” race.
This primary dataset yielded 15 predictive variables (5 races × 3 name segments). We supplemented this with US 2010 census data (U.S. Census Bureau, 2010) for additional demographic breakdowns by race for surnames. The census data included two categories not present in the Rosenman dataset: “American Indian” and “2 or more races”, adding two more variables specifically for last names.
Since no comprehensive suffix dataset exists, we created boolean indicators for the most common suffixes: JR/SR designations and Roman numerals.
Preliminary analysis revealed that both middle name and suffix variables contributed insignificantly to classification accuracy. Middle names alone achieved 41.84% accuracy in five-race classification and 49.03% in three-race classification, worse than the naive baseline of predicting all individuals as White (54.46% and 55.7% respectively).
Suffix variables added to first and last names provided no significant improvement in either classification scheme. When both variable sets were removed from the full model (including mugshot and census features), the effect on accuracy was insignificant.
Additionally, principal component analysis showed middle name variables introduced spurious double clustering artifacts without improving racial separability. We excluded all middle name and suffix variables from subsequent analyses.
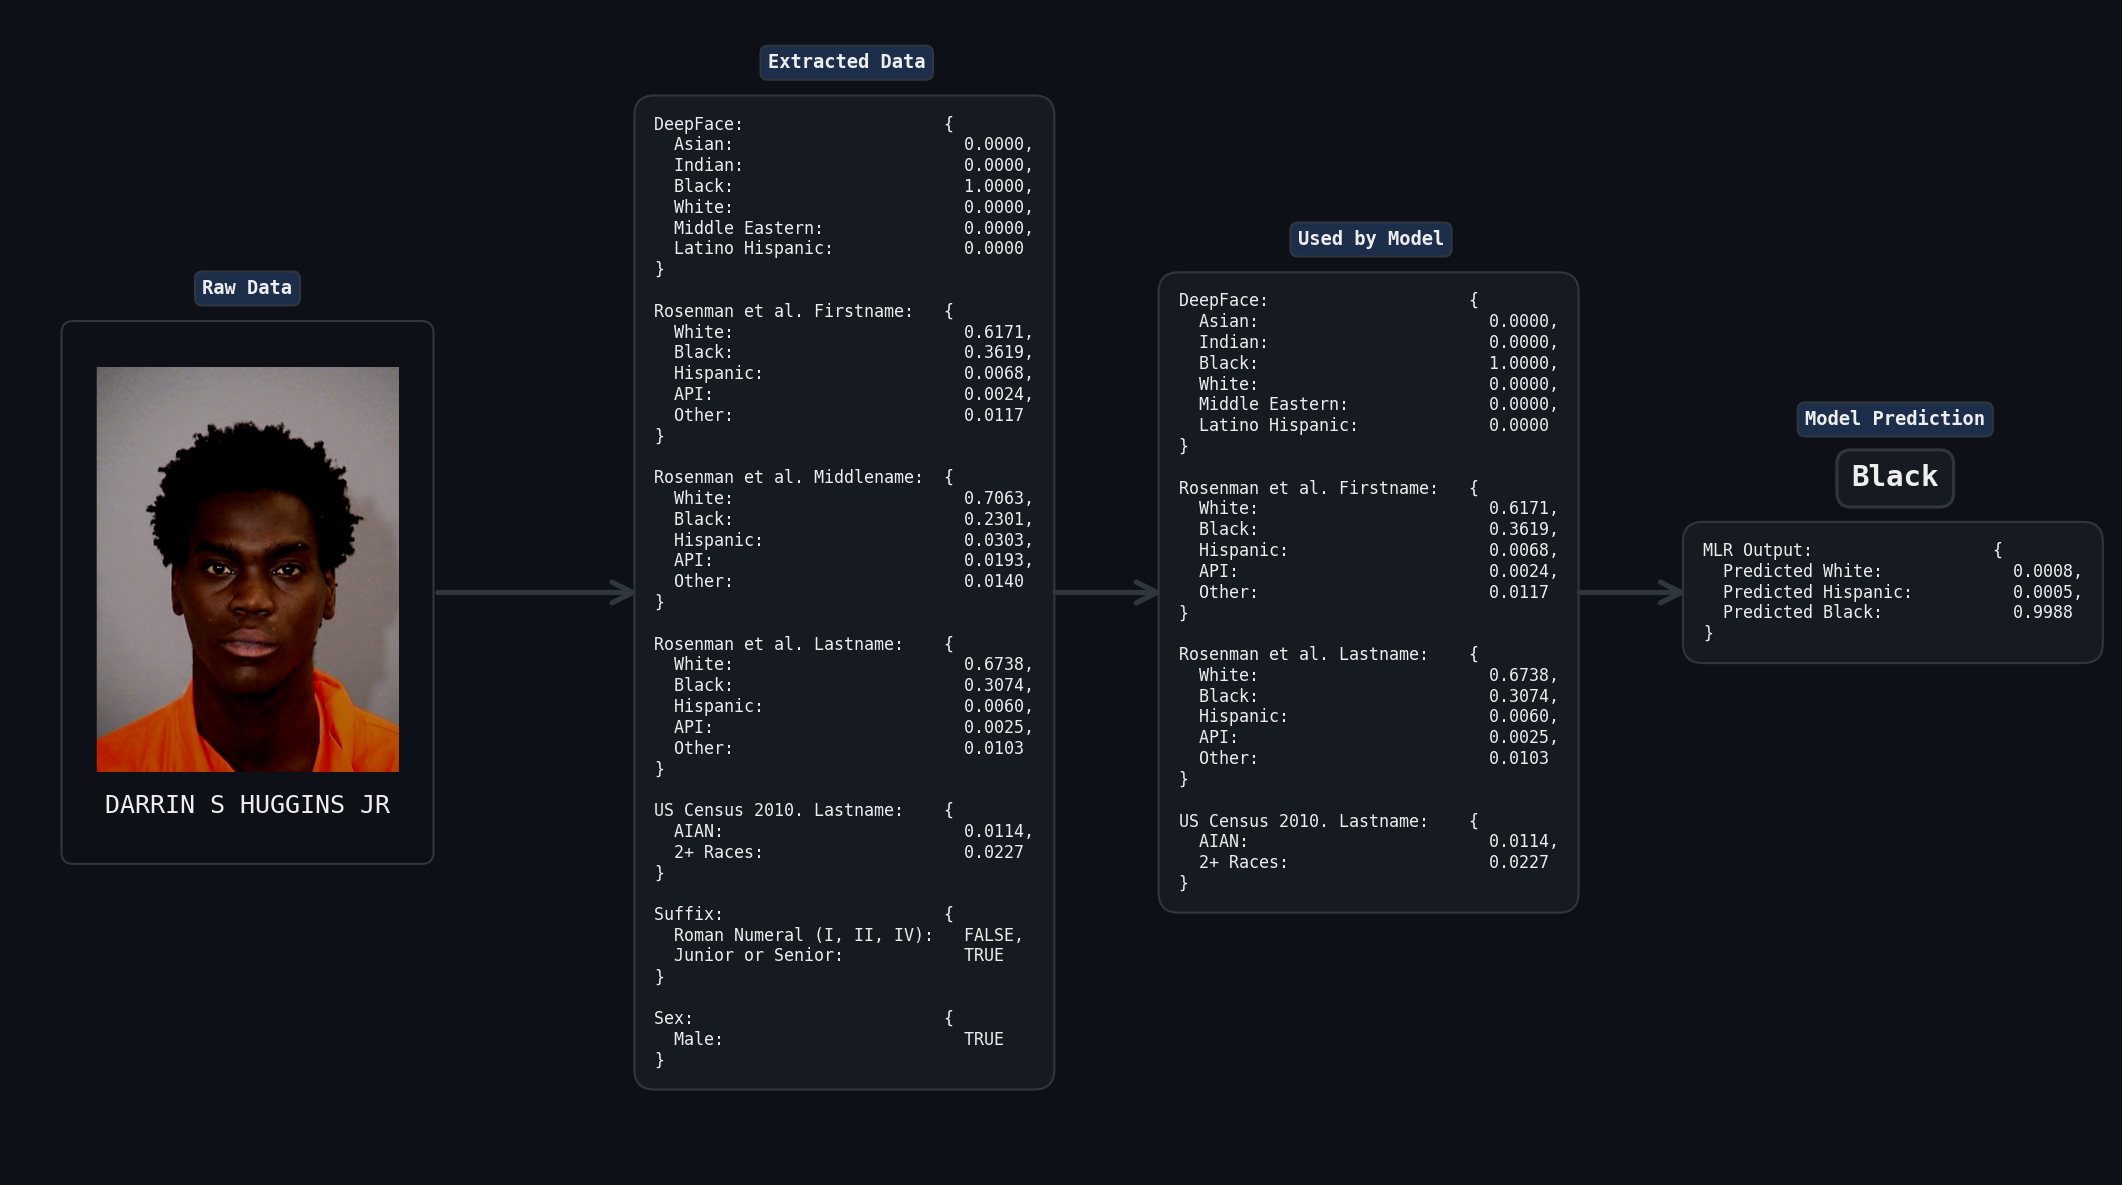
Overall, our final name-based prediction system comprised 12 variables: 5 from first names and 7 from last names. Combined with DeepFace’s 6 mugshot-derived variables, our complete model incorporated 18 predictive features for racial classification. The figure below highlights the pipeline for our model using these variables.
Method
Overview
Our goal is to identify systematic bias in racial assignment by corrections authorities. We do this by training a linear (not literally OLS, just not non-linear) model on DOC-assigned race labels, then interpreting systematic deviations between model predictions and official assignments as evidence of mislabeling rather than model error.
Why does this work?
A model trained on biased labels will still learn the underlying signal (true race) rather than the bias itself. This occurs when two conditions hold:
-
The predictors capture genuine racial differences (facial features, name demographics).
-
The model achieves sufficiently high accuracy that it fits the dominant signal in the data rather than noise.
Linear models are particularly well-suited for this task because they fit overall linear relationships between predictors and outcomes, effectively averaging through systematic bias patterns rather than overfitting to them. We opted to use Multinomial Logistic Regression. Under these conditions, systematic deviations between model predictions and official classifications indicate bias in the original labels. In simulations later, we validate this approach by introducing bias into a generated dataset and demonstrating that our method successfully detects it.
When training the model, it’s also critical that the prediction value of each class is weighted inverse to its proportion in the dataset.
This prevents our model from biasing towards classifying everyone as White or Black simply because Whites and Blacks constitute the majority of criminals. Without this weighting, it would appear that minority classes are mislabeled as White or Black, which is not what we’re trying to capture.
What Races Should we Include in our Analyses?
We don’t just have Black, White and Hispanic classifications. We also have Unknown, Other, Asian and Native American. This leaves us with many races we can predict, not just the three.
However, as discussed in the overview, we need sufficiently high accuracy to be confident that deviations capture mislabeling rather than model error. Thus, we should test how our model performs with everything (including Unknown + Other), the five-race classification, and the BWH (Black-White-Hispanic) combination only. We’ll determine for ourselves what is sufficient, but >90% accuracy on multi-class classification is preferable.
Separability and Dimensionality Reduction
A critical methodological concern involves disentangling genuine bias from natural classification difficulties arising from differential phenotypic distinctness between racial groups. Certain racial categories exhibit closer genetic ancestry, physical appearance, and naming patterns than others. Most notably, the relatively modest differences between Hispanics and Whites compared to the more pronounced distinctions separating these groups from Blacks.
This natural variation in inter-group distinctness generates a testable prediction: if misclassification patterns simply reflect inherent classification difficulty rather than systematic bias, we should observe higher accuracy rates for more phenotypically distinct groups (such as Blacks) and proportionally higher error rates for phenotypically similar groups (Hispanics and Whites). Under this scenario, elevated misclassification rates between similar groups could be attributed to reduced Euclidean distance in feature space rather than systematic bias.
This analysis is complemented by classification models, as they are fundamentally designed to maximize separability between groups, trained explicitly to find the boundaries that best distinguish categories even when those boundaries are subtle. If our model achieves high overall accuracy, it demonstrates that the racial groups are sufficiently separable in our feature space. Persistent misclassification of a specific pairing at high confidence would then suggest something other than mere phenotypic similarity—it would indicate cases where the model has detected strong, convergent evidence across multiple predictive features (mugshot analysis, name demographics) pointing toward one classification while official records show another.
When such high-confidence predictions contradict official classifications at rates exceeding random error, this indicates consistent patterns of misclassification rather than model uncertainty. We’ll explore the relationship between model confidence and racial classification to quantify whether these patterns reflect random errors or systematic bias.
Simulations
To validate our methodological assumptions and develop a framework for interpreting real-world bias patterns, we constructed controlled simulation studies using synthetic datasets with known bias characteristics. These simulations enable us to test whether our analytical approach can successfully detect and characterize different types of systematic bias under controlled conditions.
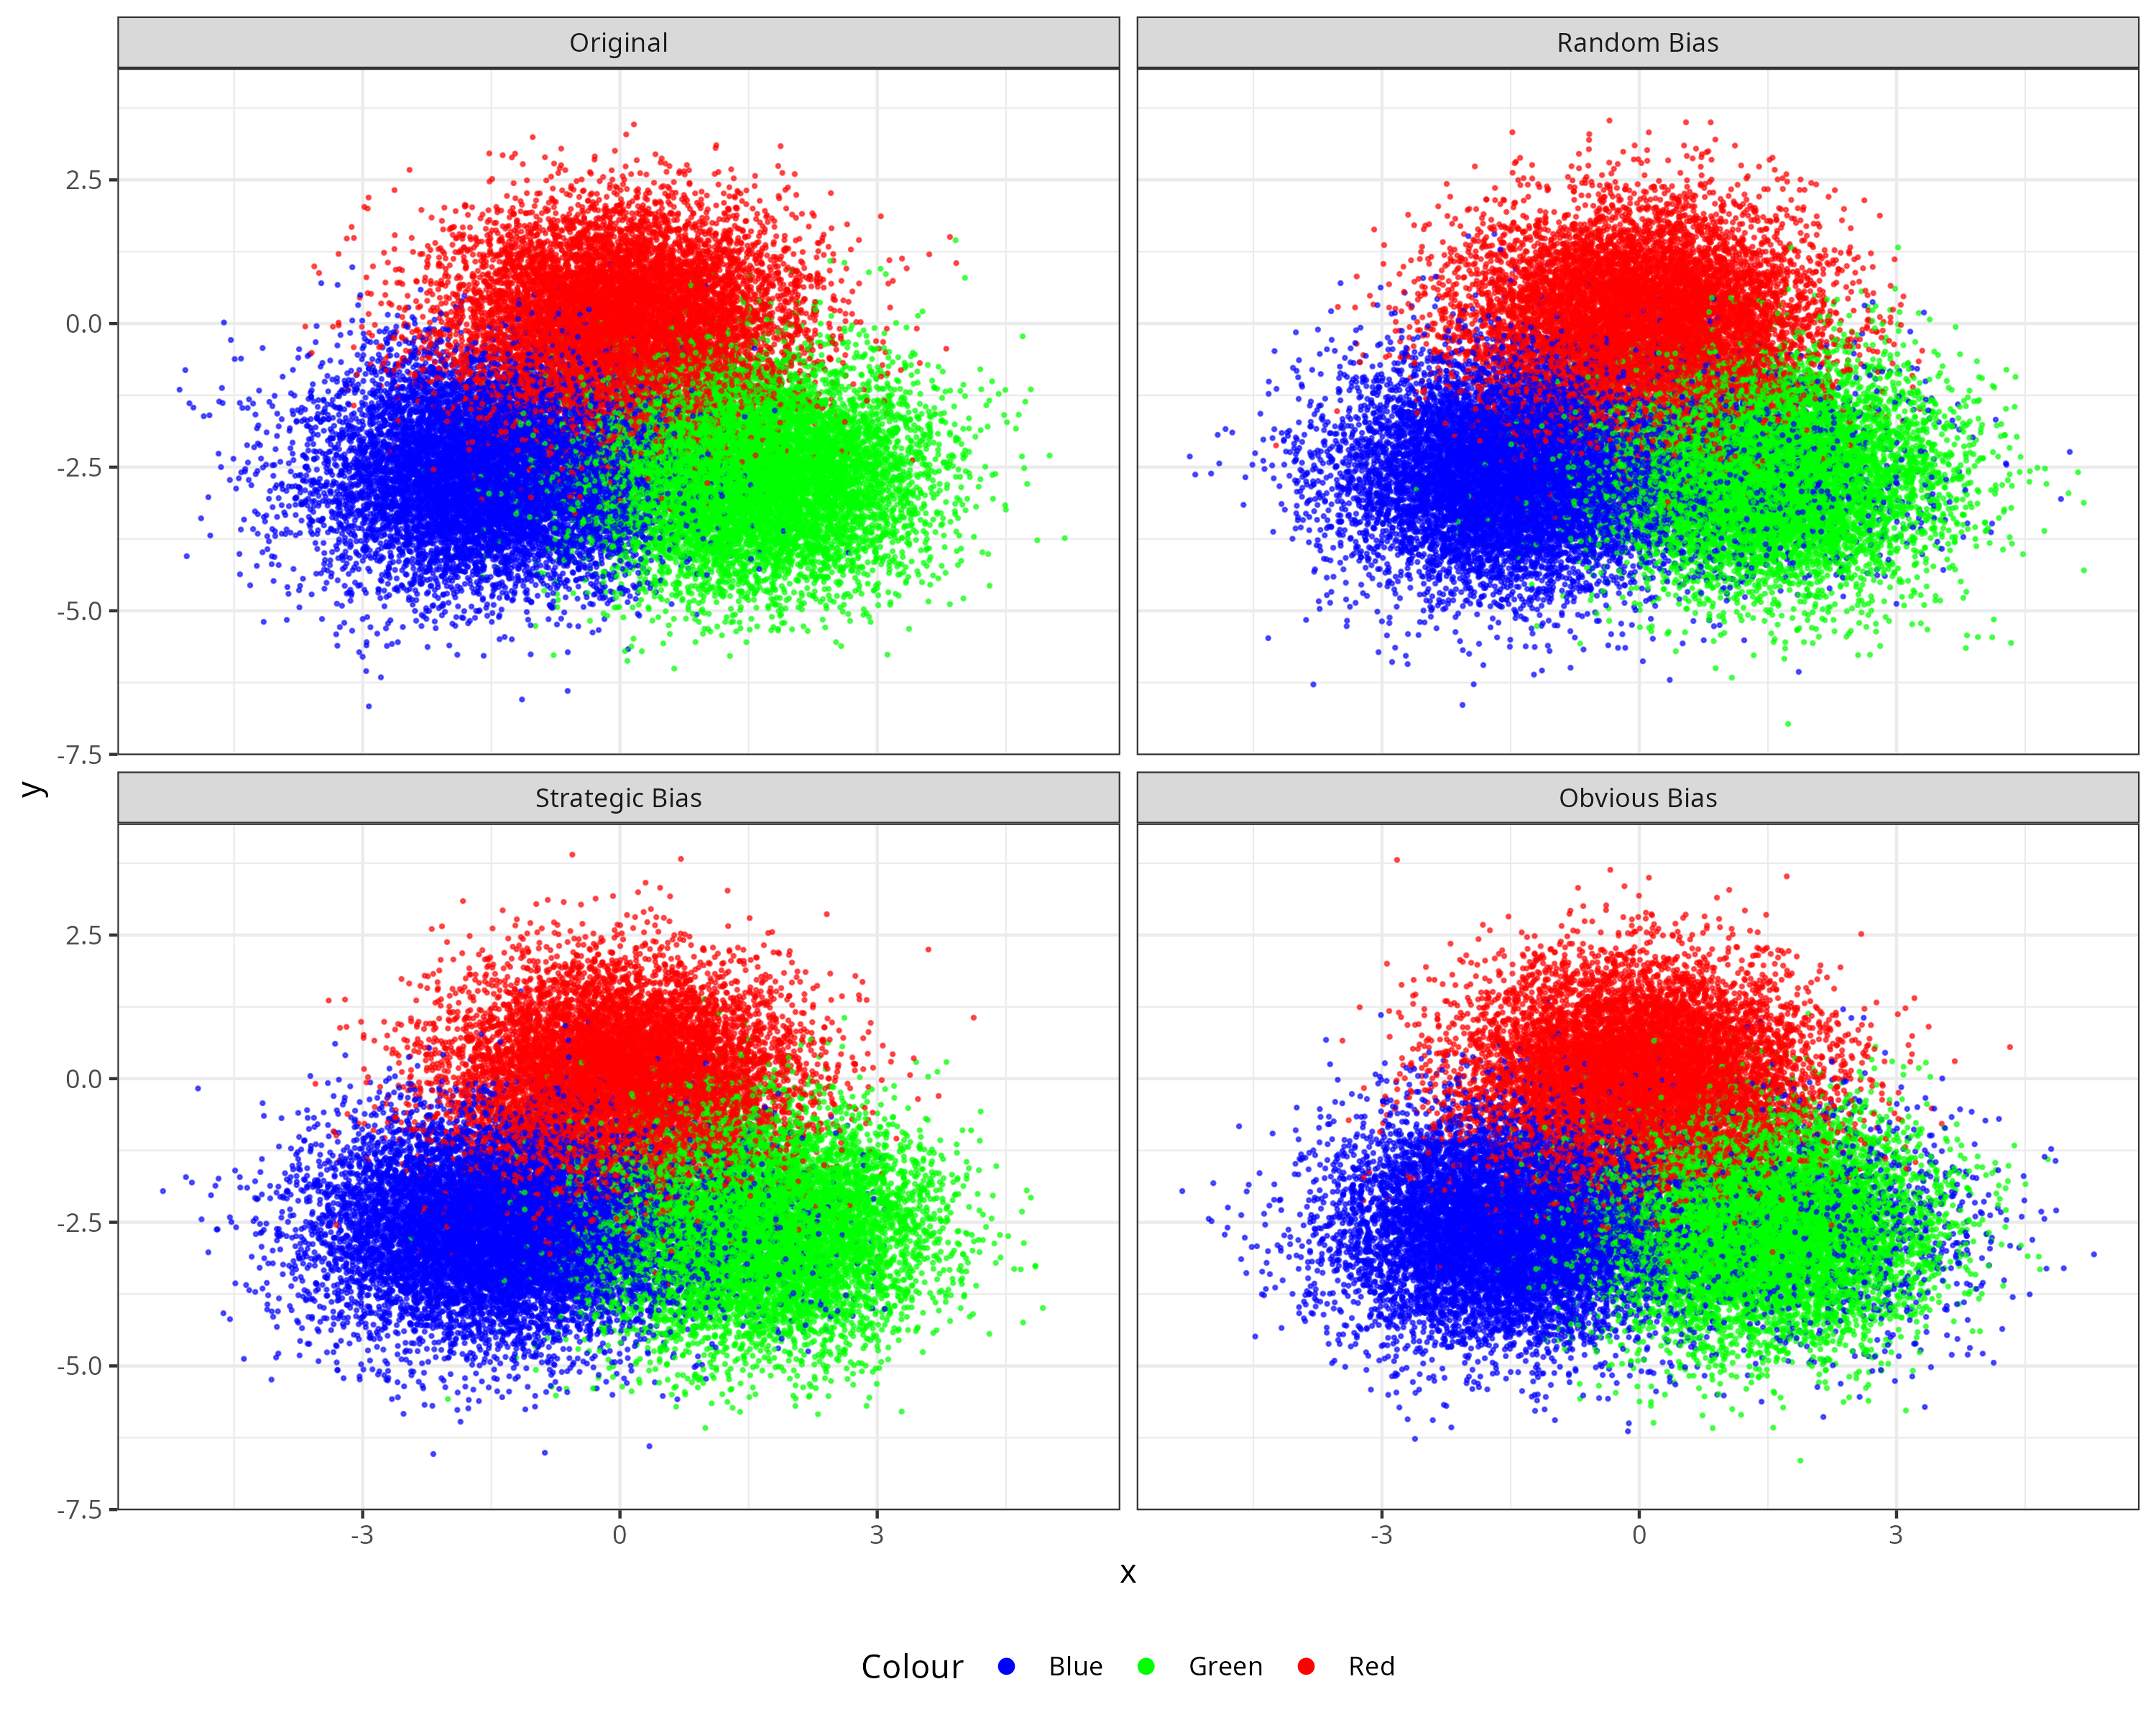
Our simulation framework employed a simplified three-group structure (Red, Blue, Green) designed to mirror the essential characteristics of our real-world three-race analysis while maintaining interpretive clarity. This design facilitates direct comparison between simulated and observed bias patterns.
We constructed our synthetic data within a two-dimensional feature space. Since our primary methodology relies on linear modeling techniques that do not assume complex nonlinear interactions between variables, higher-dimensional representations would introduce unnecessary complexity without enhancing our ability to detect the linear bias patterns central to our analysis. The two-dimensional approach also enables clear visualization of bias patterns and model performance.
Within this simplified space, we positioned each group with equal separation distances of three standard deviations between all group centroids, ensuring balanced distinctness across categories. We then introduced three distinct bias types affecting only the Blue and Green groups, leaving Red as an unbiased control:
- Random bias: Greens randomly assigned to Blue.
- Strategic bias: Greens closest to the Blue mean assigned to Blue.
- Obvious bias: Greens furthest from the Blue mean assigned to Blue.
For each bias scenario, we reassigned 10% of Greens to Blue classification, with the selection mechanism varying according to the specific bias type being simulated.
If you’re interested in the mathematics and setup, see the appendix.
State Analysis
Operating under our methodological assumption that model predictions represent ground truth, we calculated state-specific misclassification rates for each racial group, focusing on categories where systematic bias appears likely based on our overall findings.
To test whether any detected bias reflects deliberate discrimination versus random administrative error, we examined correlations between state-level misclassification rates and political ideology, measured through Republican vote share in recent elections. Systematic correlations with political variables would suggest intentional bias, while their absence would support alternative explanations such as administrative inconsistency or measurement error.
We also investigated whether genetic ancestry composition influences misclassification patterns. Using ancestry data from Bryc et al. (2015), we tested whether misclassification rates correlate with population-level genetic distinctness between racial groups within states. This analysis helps distinguish between bias arising from genuine classification difficulty due to genetic similarity versus systematic administrative bias.
Results
The Races We Included in our Analyses
Finally, the results! First, how do our models perform for each racial category?
The correlation matrix shows that the best model for five-race classification struggles to predict Native American and Asian or Pacific Islander. Native American achieves only 14% accuracy, Asians only 51%.
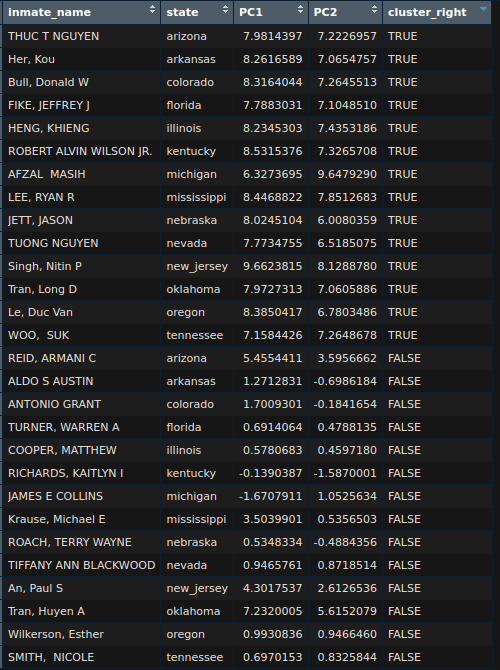
On the PC1/PC2 map, Native Americans and Asian Pacific Islanders confirm this challenge. The Native Americans cluster almost on top of Whites and overlap significantly with Hispanics.
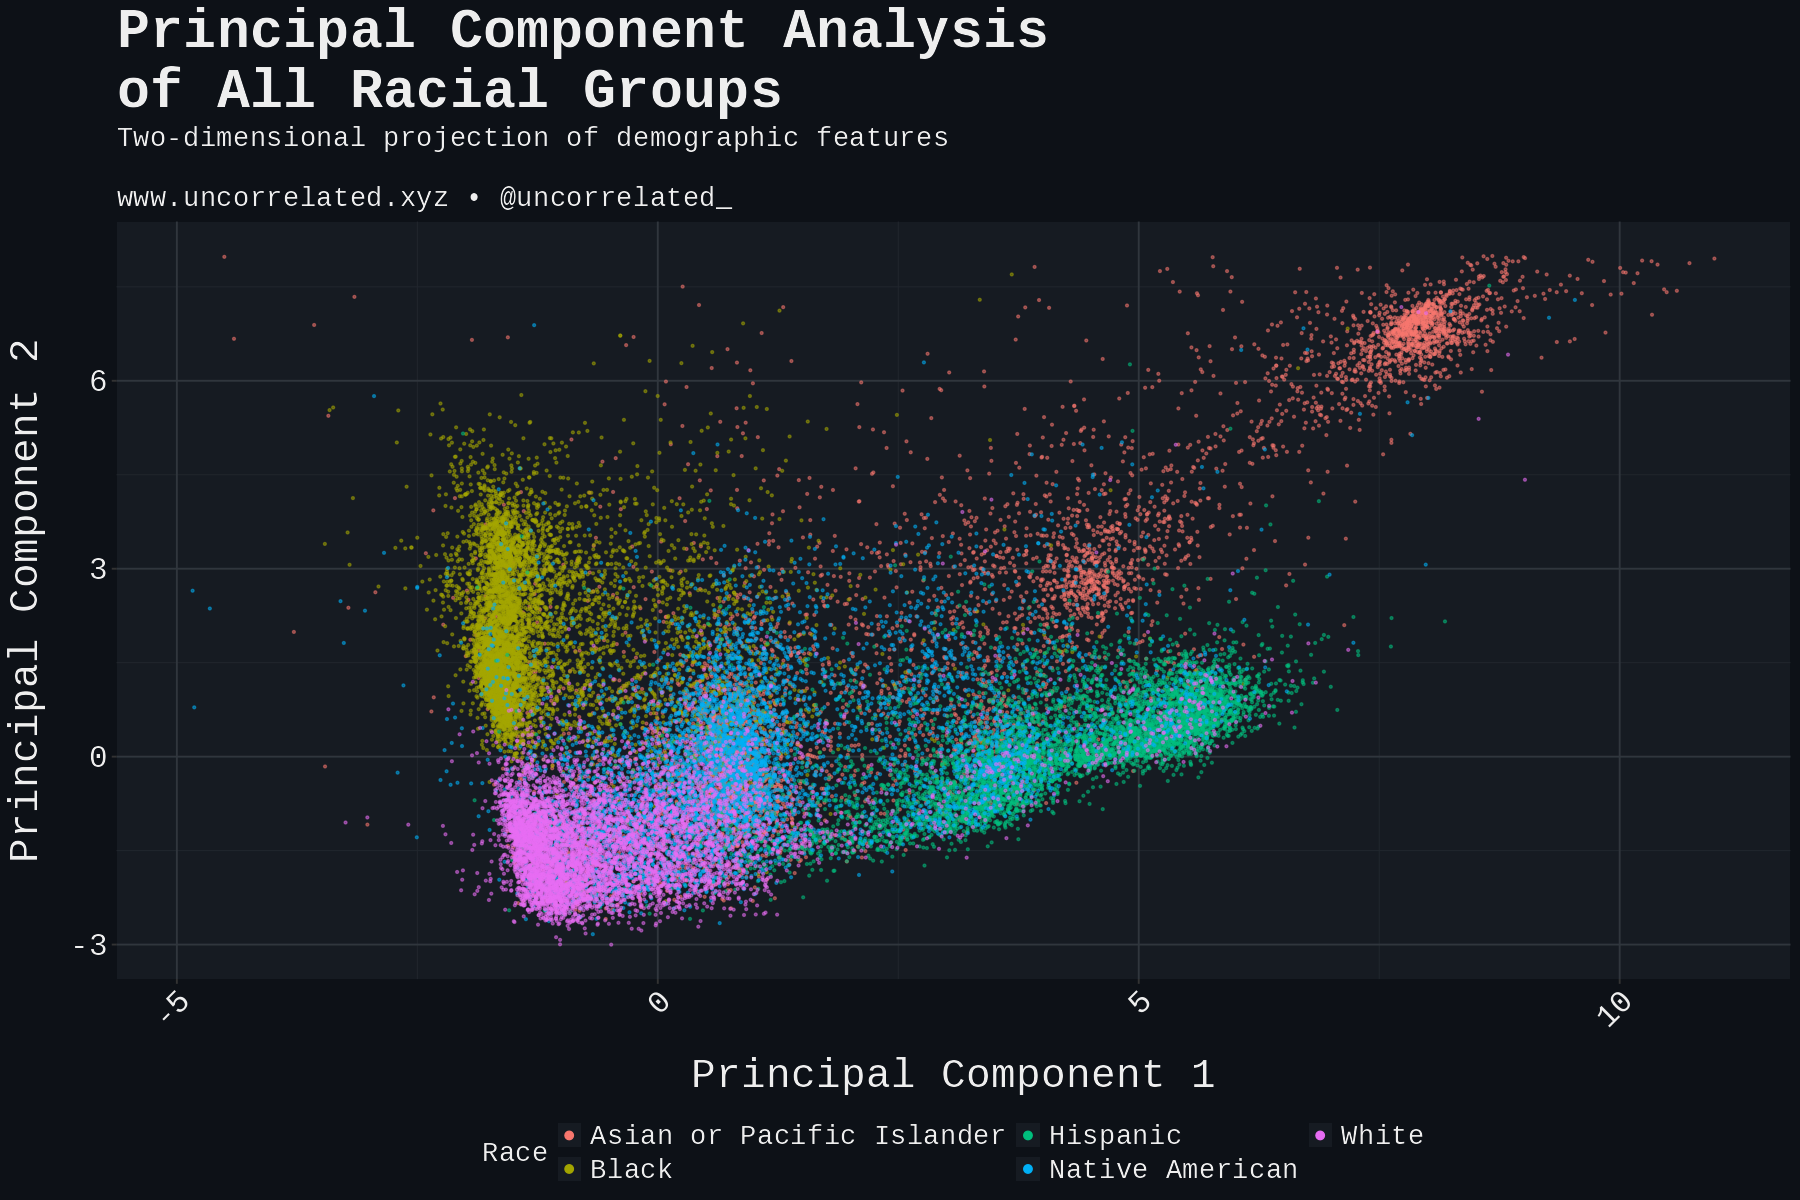
Curiously, you can also see two distinct clusters for Asians and Asian Pacific Islanders. Isolating this cluster, we can examine the names of these individuals. Here’s a randomly selected sample of Asian Pacific Islanders within the top right cluster and outside of it. Indians and East Asians appear to belong to it.
Continuing on, Unknown + Other fared even worse. The model tended to ignore the classification, with predictions falling randomly to each race. We’ll dismiss these classes from now on.
A table looking at overall accuracy by the races we chose to predict shows that Black-White-Hispanic is the only model that achieved overall accuracy >90%.
| Classification Scheme | Categories | Naive Baseline | Best Model Accuracy | Improvement |
|---|---|---|---|---|
| All races + Unknown | 7 | 52.84% | 83.68% | +30.84% |
| All races (clean) | 5 | 54.46% | 84.14% | +29.68% |
| Black-White-Hispanic | 3 | 55.7% | 92.76% | +37.06% |
This >90% threshold holds true for all races in the BWH model only. As a result, our analyses will focus on Blacks, Whites and Hispanics going forward.
All features contributed cumulatively and significantly to our result: both names and mugshots are important for accurate classification.
| Feature Set | Five-Race Accuracy | BWH Accuracy | Improvement |
|---|---|---|---|
| Mugshot-derived only | 77.17% | 81.76% | +4.59% |
| Last name features | 66.31% | 68.92% | +2.61% |
| First name features | 61.15% | 68.18% | +7.03% |
| All name features (first, last) | 71.75% | 75.67% | +3.92% |
| All features | 84.14% | 92.76% | +8.62% |
Flipping the Matrix
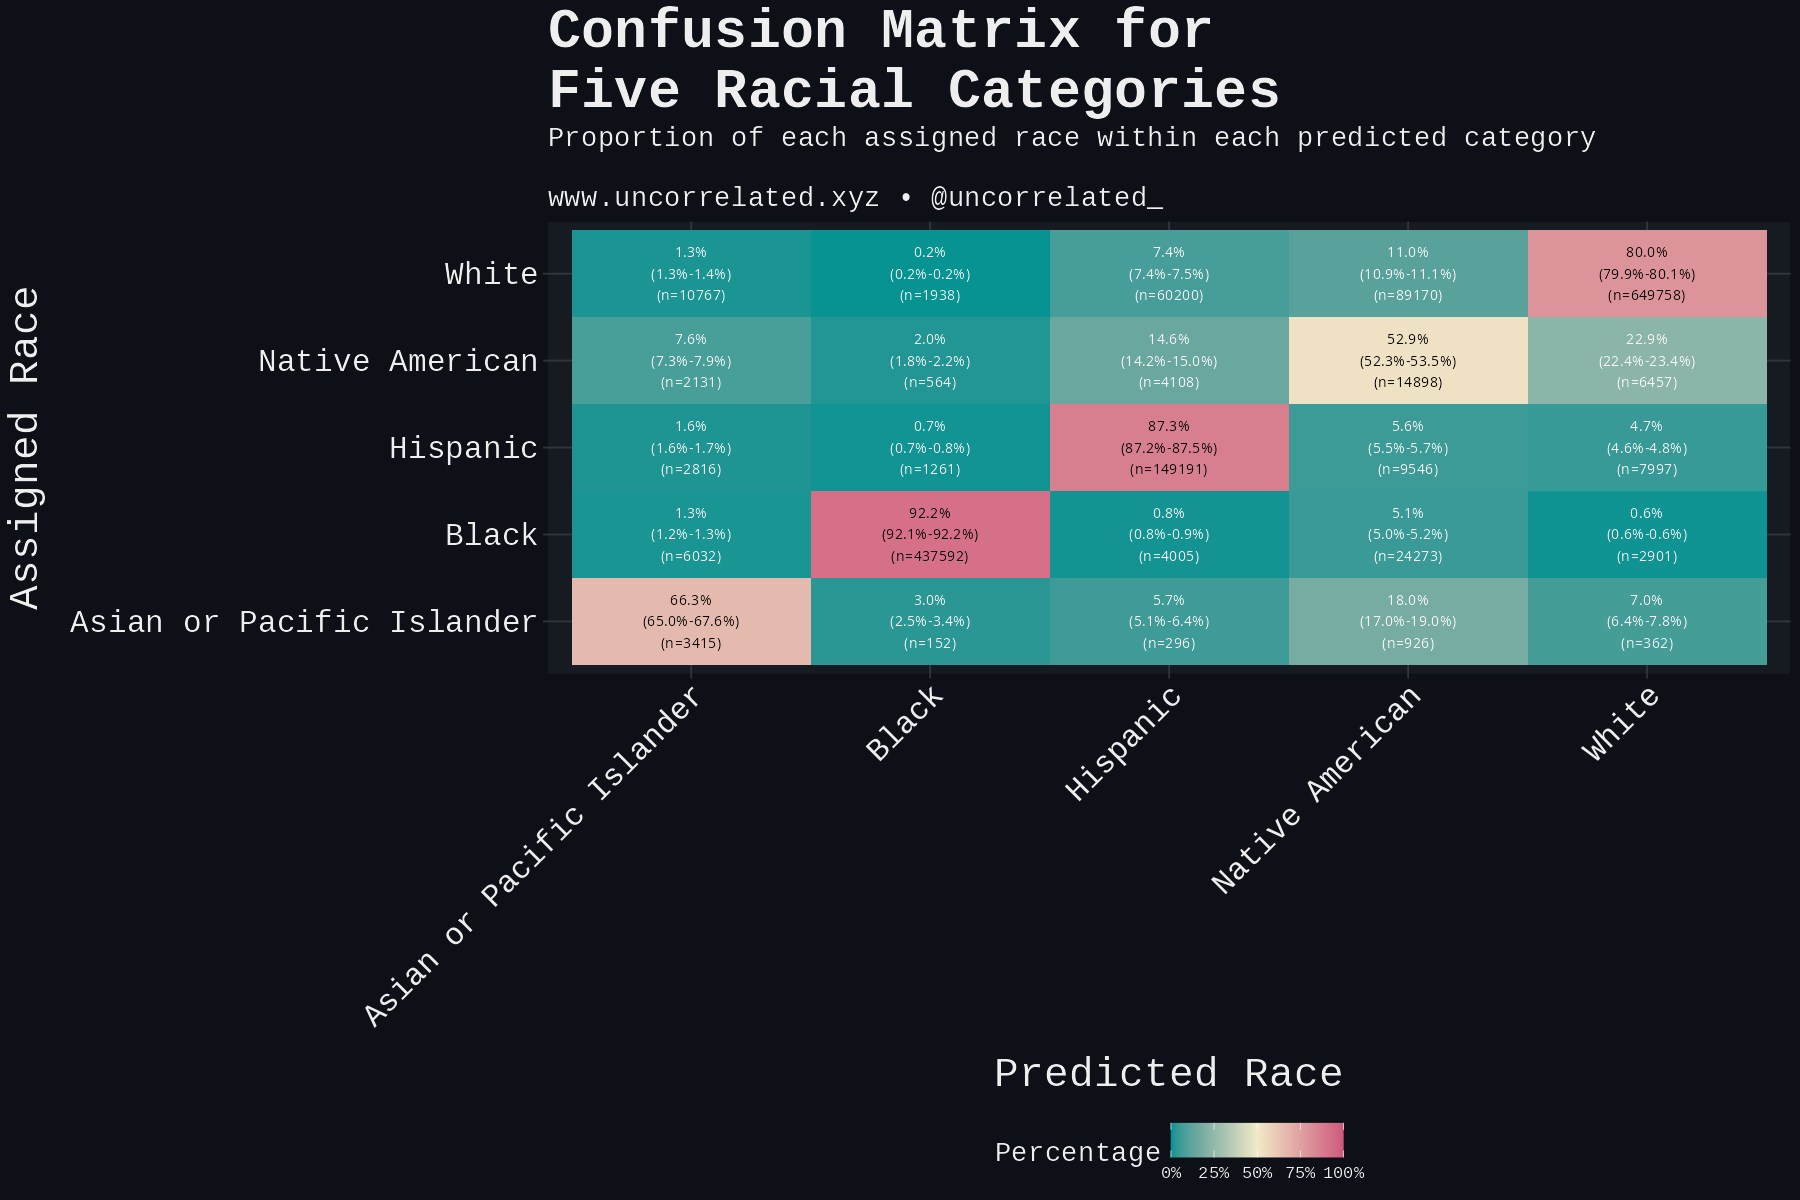
The correlation matrix above assumes that the assigned race is the true race and the predicted race is error. However, given the model assumptions we outlined, this is reversed! The assigned race is the potential error, with the true race being the prediction. We must flip the matrix:
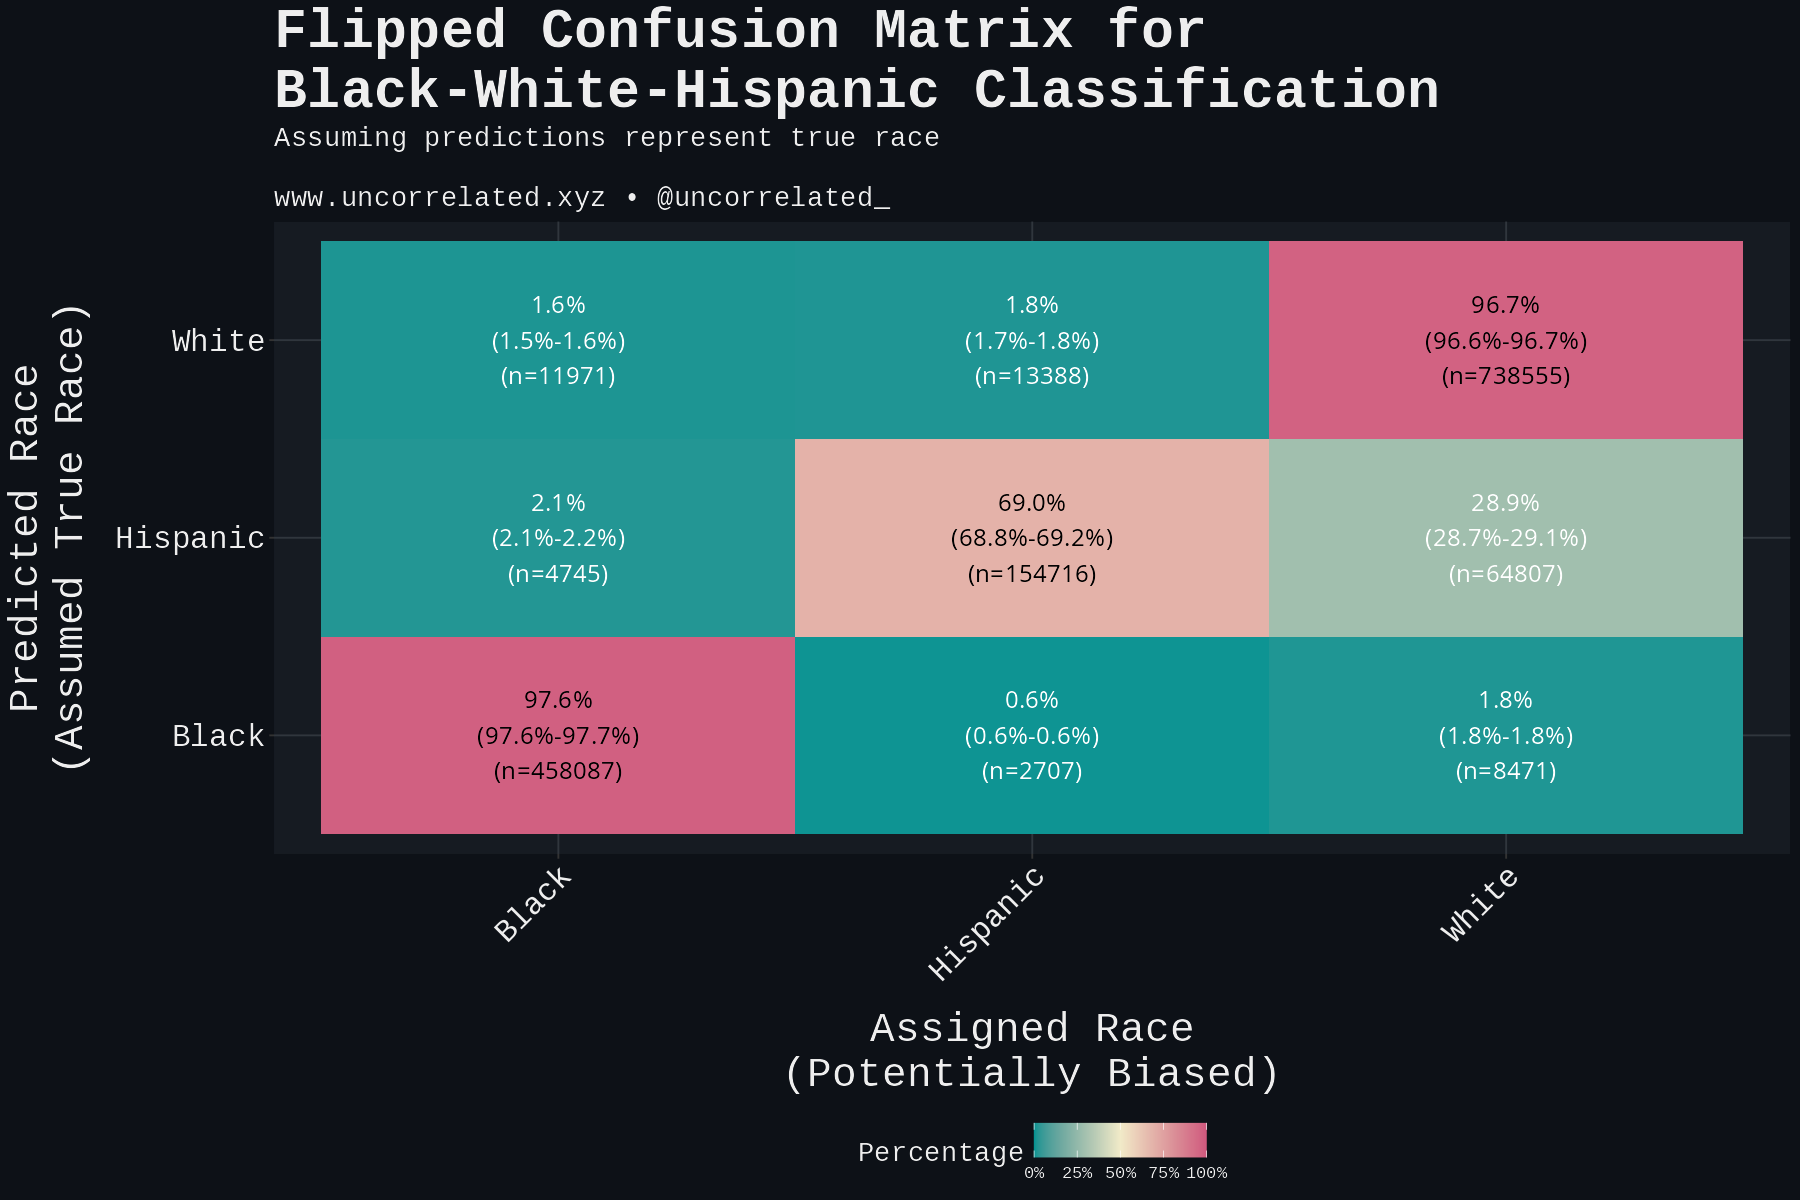
Now we can see the misclassifications! Nearly 29% of genuine Hispanics were classified as White! This is a preliminary indication of bias, but it could also be the model failing. Phenotypically, Hispanics do look pretty similar to Whites after all. In the next section we debunk this.
Separability and Dimensionality Reduction
Here, we will show (1) in the majority of these cases the model is supremely confident that the Hispanic is “White” and (2) from dimensionality reduction, Blacks, Hispanics and Whites are equidistant, establishing that the races are separable and not closely related statistically as their appearance alone (Hispanics looking similar to Whites) would imply.
Starting with dimensionality reduction. This figure draws from a random sample of 10,000 Whites, Blacks and Hispanics from our dataset.
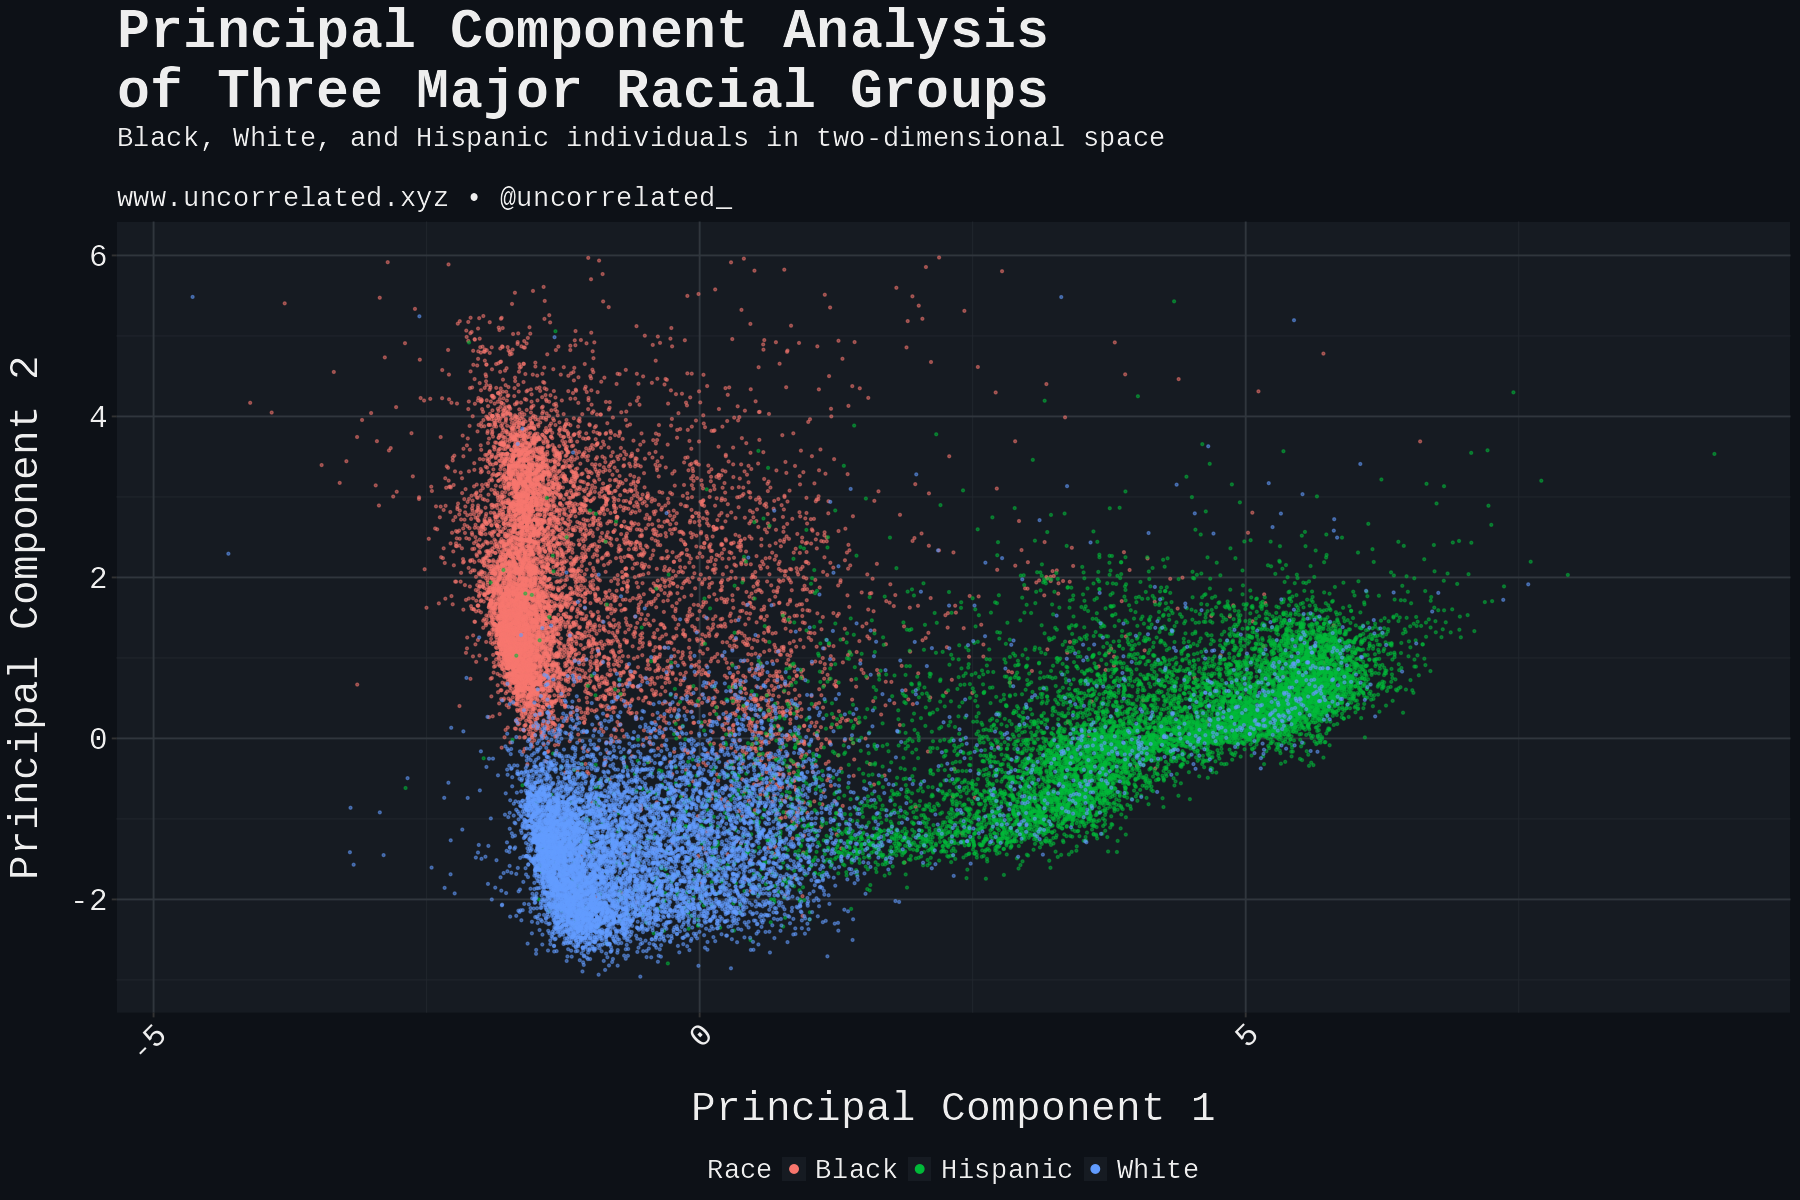
At a glance, these three groups appear about equally separable from each other. Computing the Euclidean distance across the first 16 PCs, Whites are actually closer to Blacks than to Hispanics, but Hispanics are closer to Whites than to Blacks, which confirms what the plot shows.
| Race Comparison | Asian or Pacific Islander | Black | Hispanic | Native American |
|---|---|---|---|---|
| Asian or Pacific Islander | 12.01 | 11.67 | 11.14 | |
| Black | 12.01 | 5.45 | 4.17 | |
| Hispanic | 11.67 | 5.45 | 4.34 | |
| Native American | 11.14 | 4.17 | 4.34 | |
| White | 11.92 | 3.41 | 4.53 | 3.31 |
Zooming in on the PC plot, one can see a spattering of Whites in the Hispanic zones, but not necessarily vice versa. One could say these look like Hispanics mislabeled as White!
We can take a closer look at this. To do this, we plot just the Hispanics, then a contour of the White region. Then we plot the same directly below but in reverse to see the contrast. To make the plot clearer, we’ve added 50k Whites and Hispanic points (instead of just 10k).
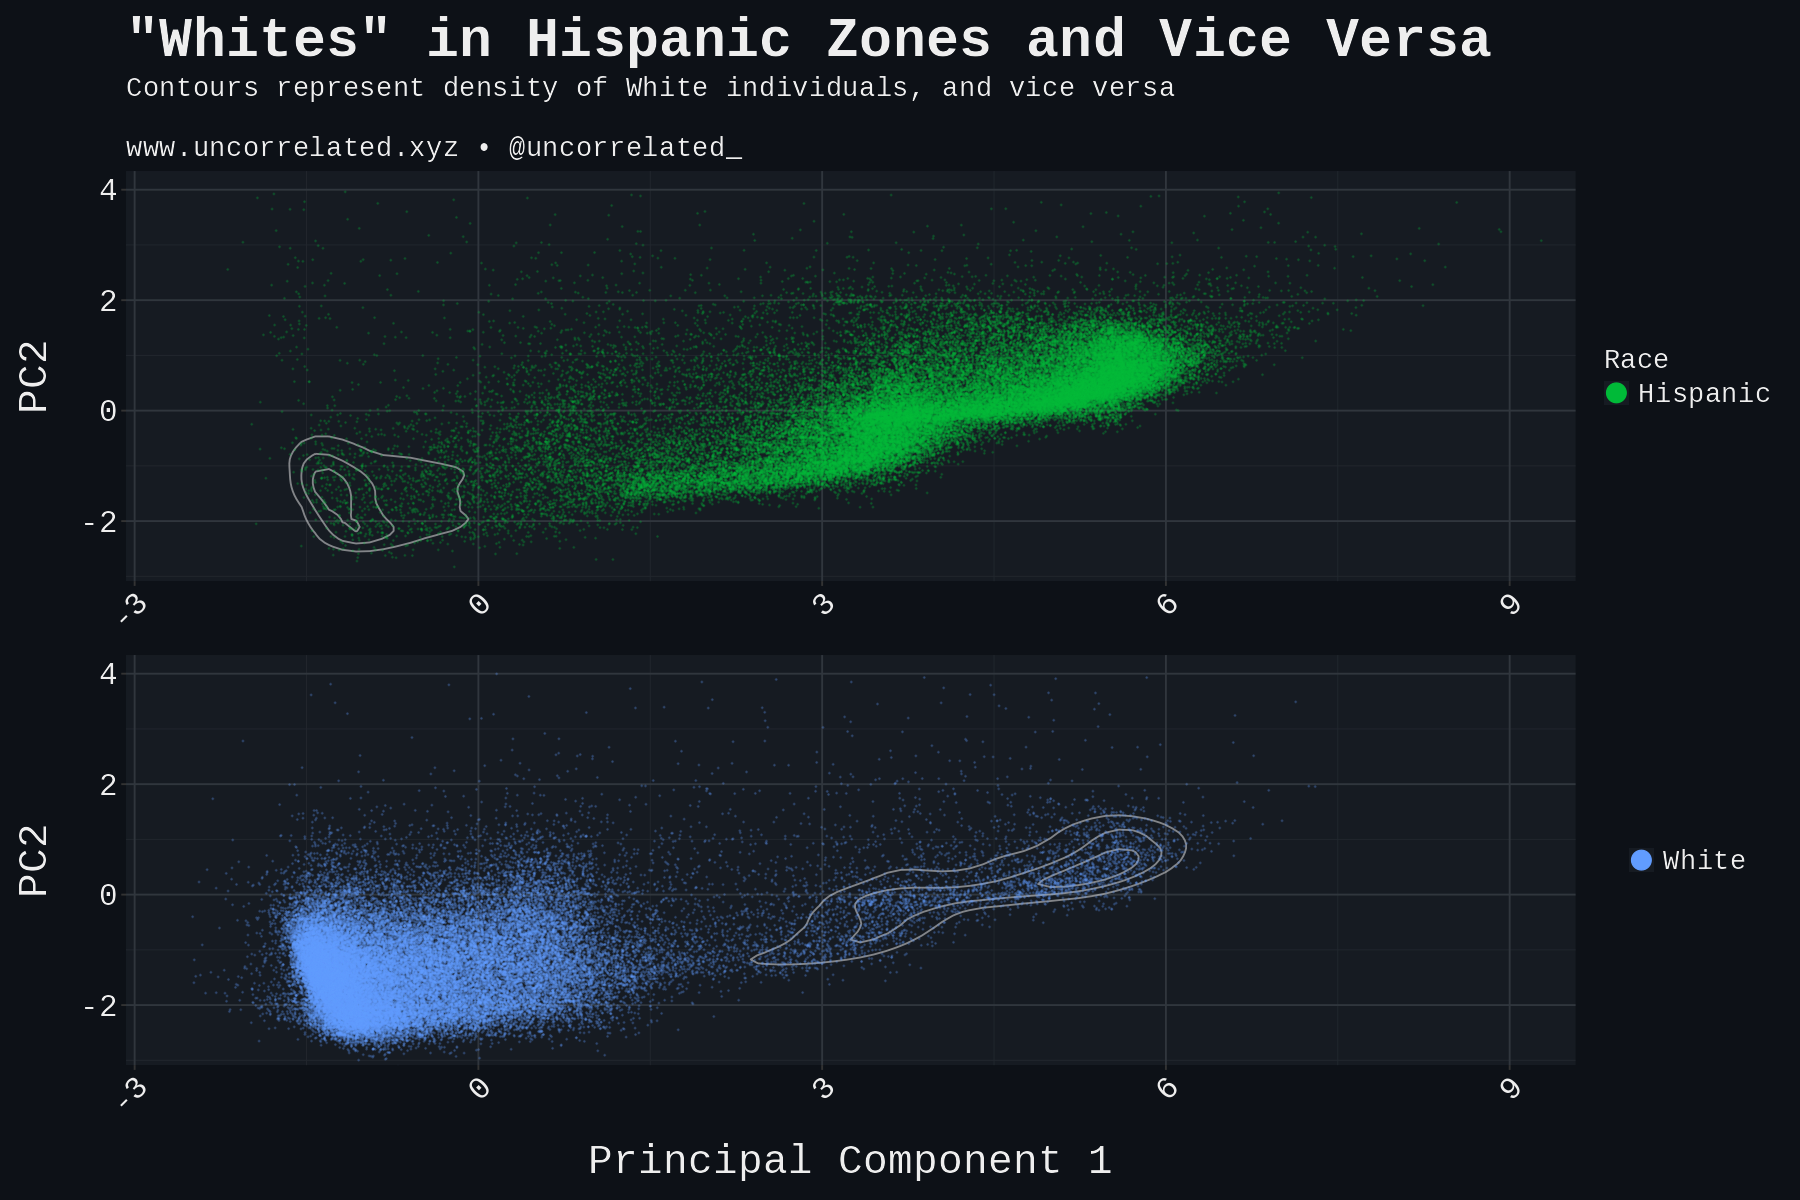
Now that’s much clearer. There are some Hispanics in the White areas, but the reverse is far more prevalent—there’s a long tail of “Whites” in the Hispanic areas, far from the White zones. Crucially, the mix of Whites within the Hispanic distribution parallels the Hispanic distribution, whereas this pattern does not hold for Hispanics located in the White region.
But this is theoretical separability. How does a model, when appropriately trained on all our variables, distinguish these racial groups? Is the model also finding “Whites” far from the White zones? Yes, and many of them.
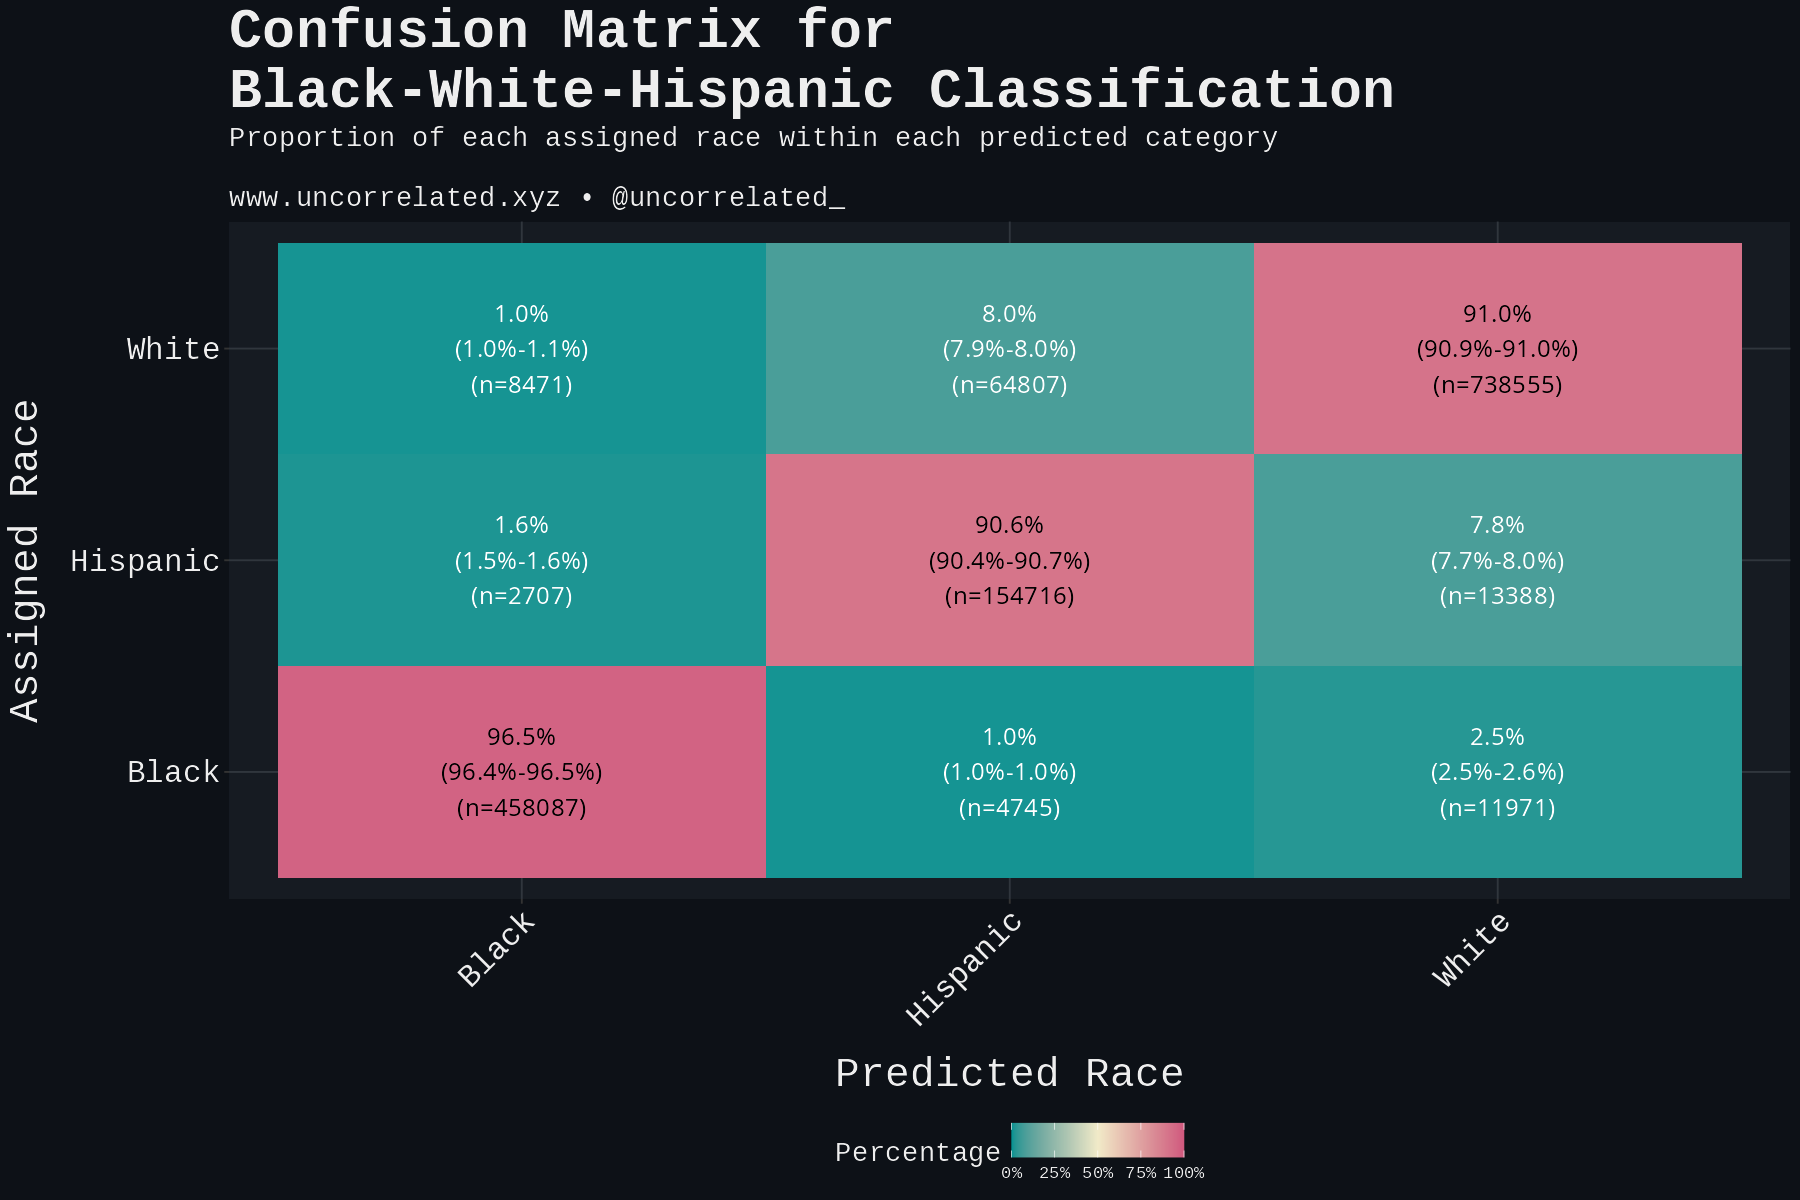
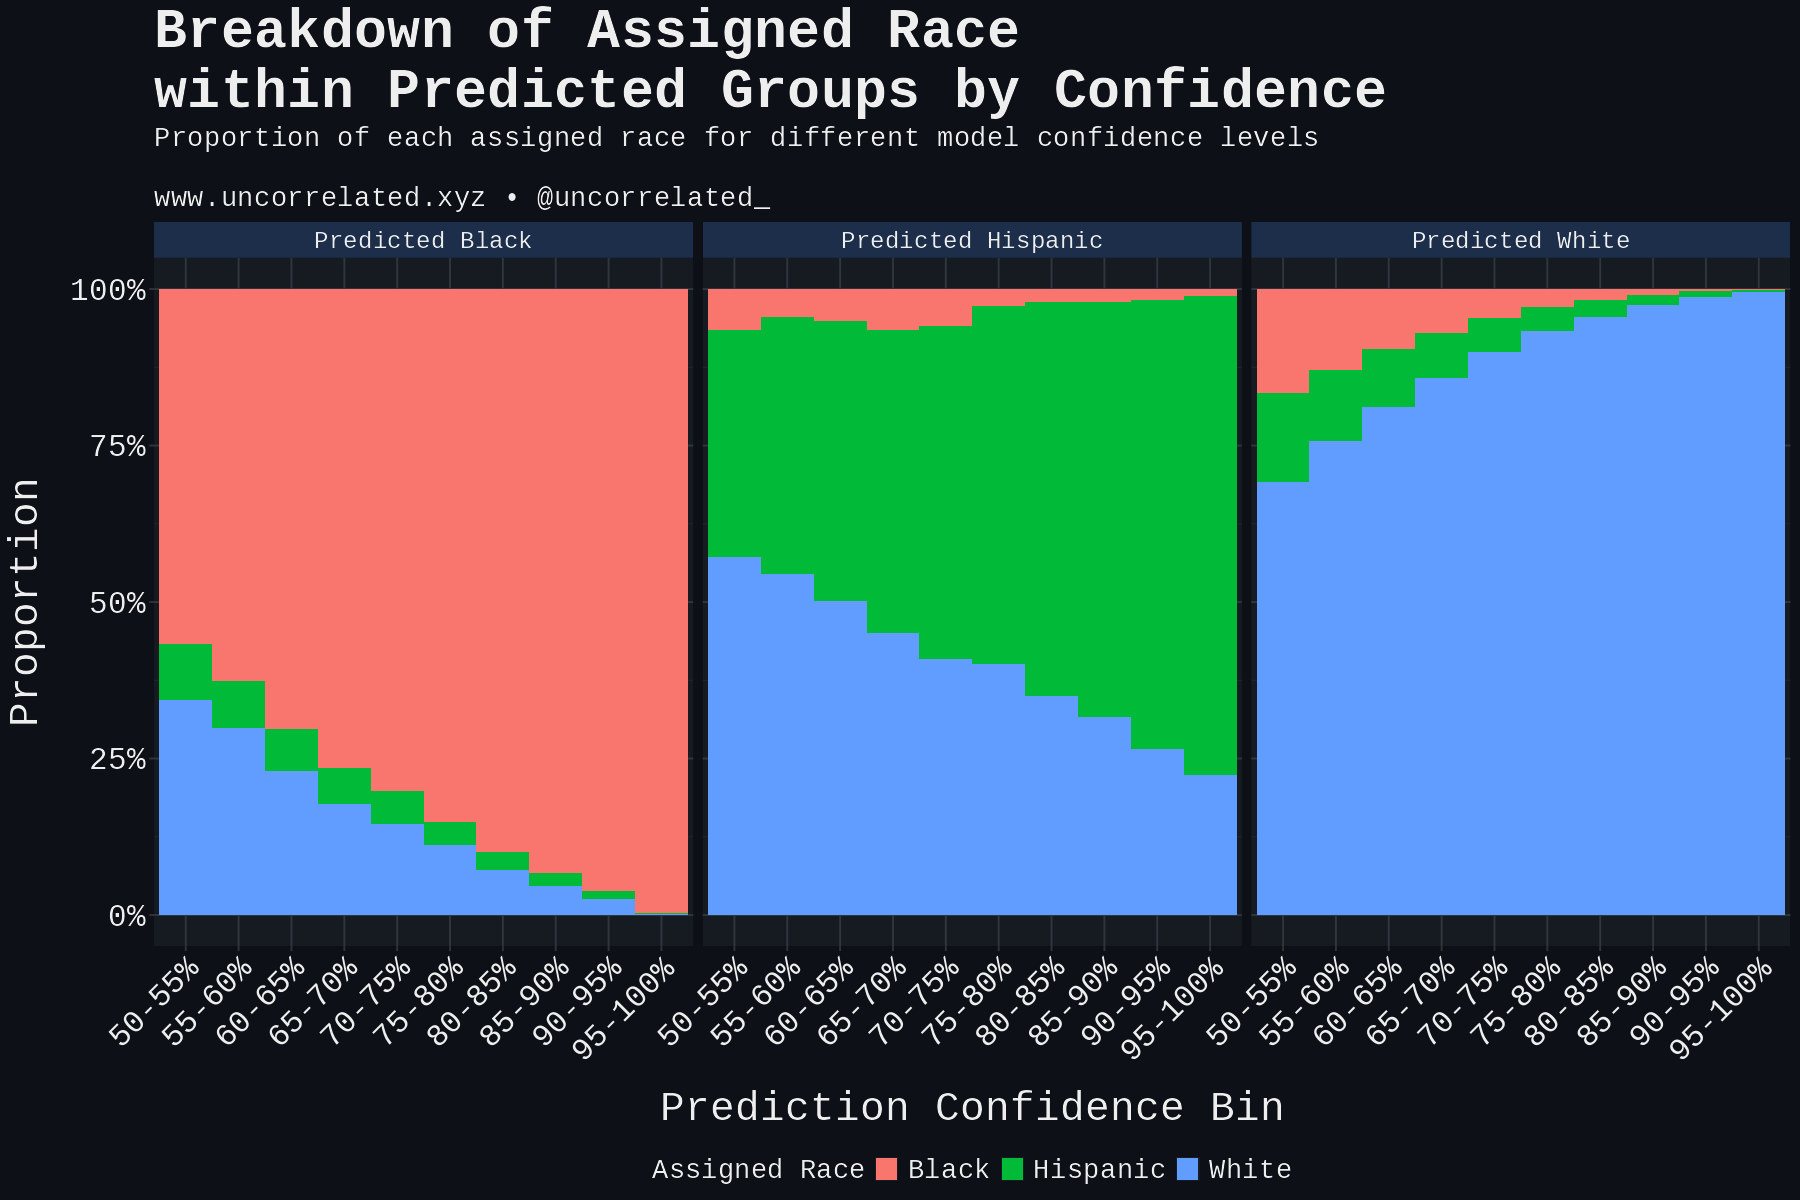
Looking at the following figure, we can see that as the model increases in confidence for its predictions of Blacks and Whites, it converges on a 100% match between the assigned race and the predicted race.
To read this plot: the title of each facet is the predicted race, the color aesthetic denotes the proportion by the assigned racial class.
As one can see, even when the model is 95-100% confident that a predicted Hispanic is Hispanic, 22.4% are labeled as White!
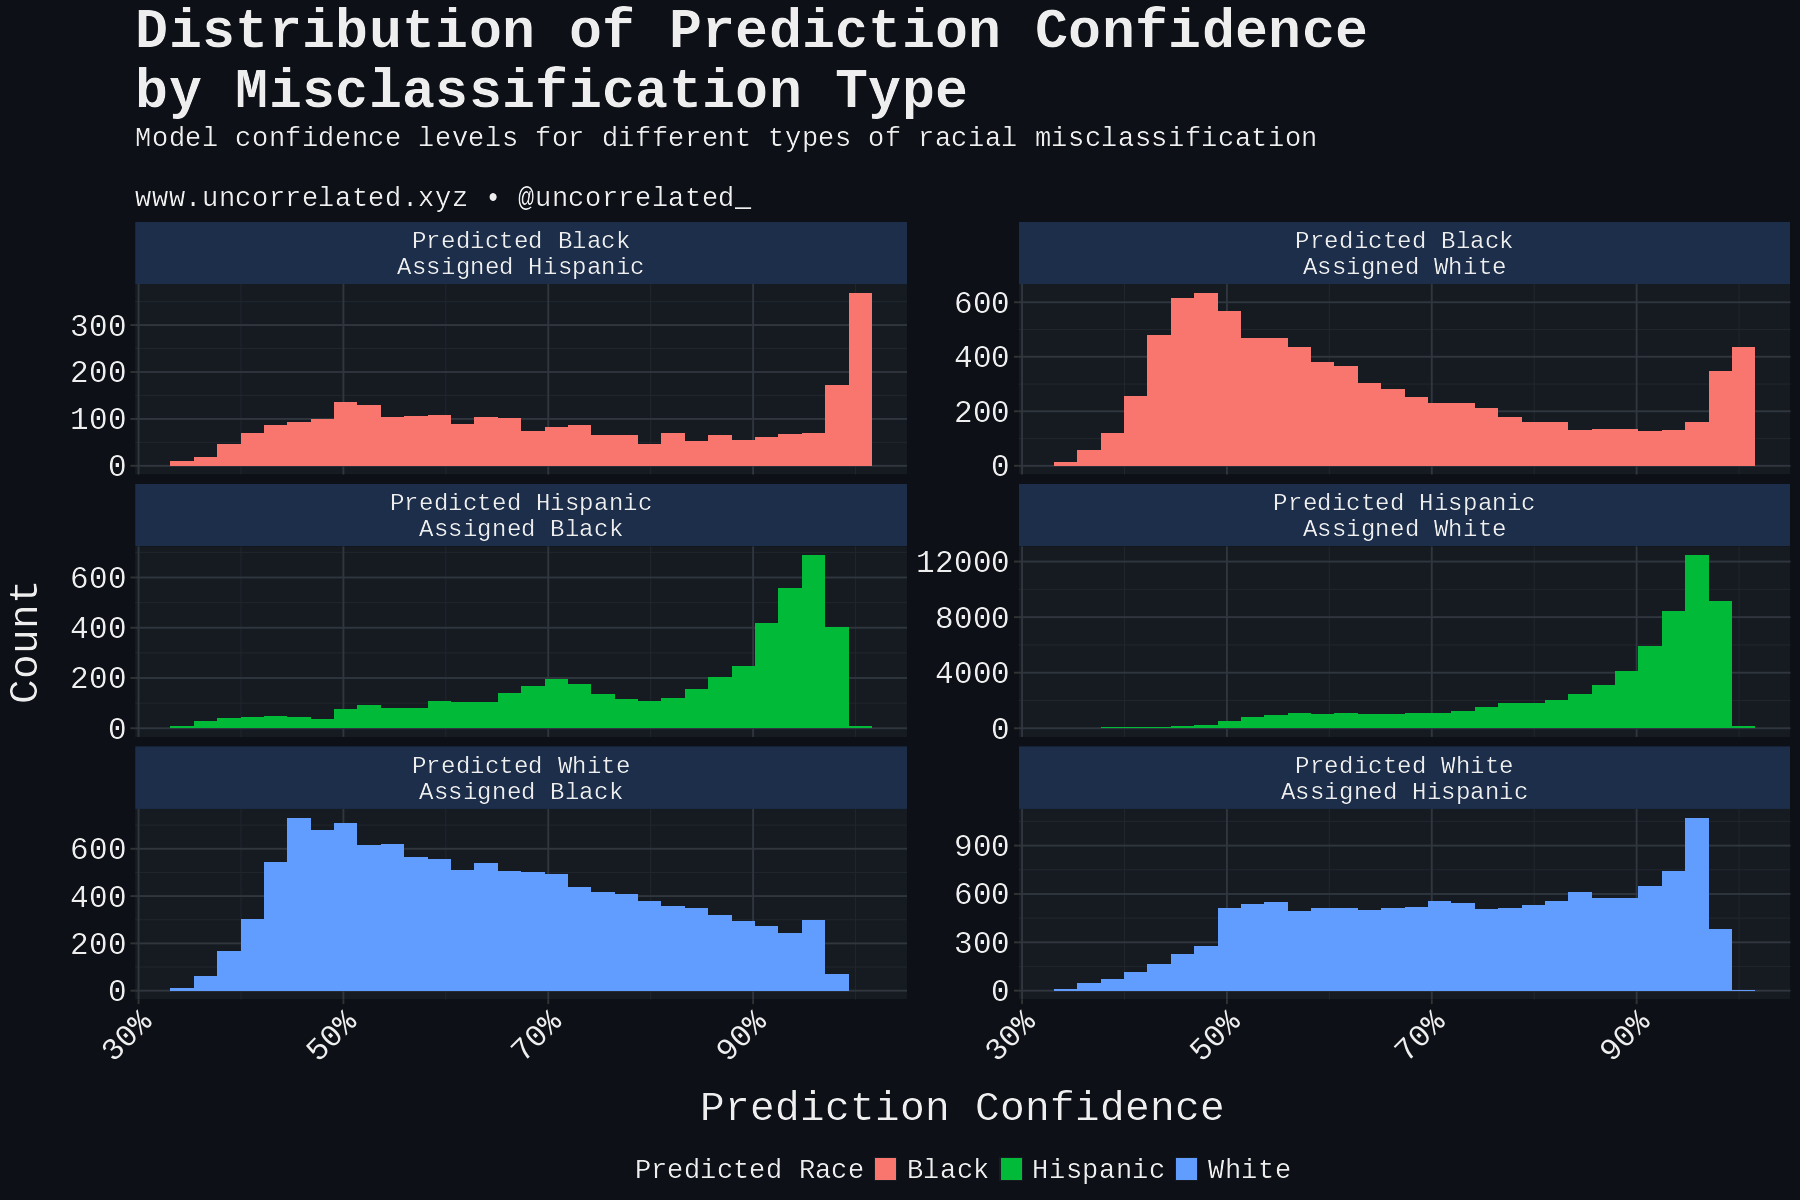
A skeptic might point out that high confidence cases might only constitute a tiny fraction of the overall misclassification. This is incorrect. The opposite is true. The median model confidence is 91.7% for predicted Hispanics assigned White.
Table X: Misclassification Confidence Statistics
| Predicted Race | Assigned Race | Count | Mean Confidence | Median Confidence | Q25 | Q75 |
|---|---|---|---|---|---|---|
| Hispanic | White | 64,807 | 86.1% | 91.7% | 80.2% | 95.9% |
| Hispanic | Black | 4,745 | 80.7% | 87.4% | 69.4% | 94.4% |
| White | Hispanic | 13,388 | 73.5% | 74.3% | 59.7% | 88.3% |
| Black | Hispanic | 2,707 | 71.4% | 69.1% | 53.4% | 92.6% |
| White | Black | 11,971 | 64.2% | 62.4% | 50.6% | 76.5% |
| Black | White | 8,471 | 63.9% | 58.9% | 48.8% | 76.2% |
Visualizing the distribution also provides context. First, predicted Hispanics have the same bias distribution not just for Whites but also for Blacks, although the latter case is orders of magnitude smaller. Second, for every distribution there’s a spike in cases where model confidence is >90%, indicating that there are severe misclassification examples for almost every race.
So far, these results alone would indicate, statistically, that there is indeed systematic misclassification of Hispanics as White.
Simulation
So what type of bias does this most closely reflect?
Recalling from our simulation method, we developed and tested three types of bias using the same method we just employed:
- Random bias: Greens randomly assigned to Blue.
- Strategic bias: Greens closest to the Blue mean assigned to Blue.
- Obvious bias: Greens furthest from the Blue mean assigned to Blue.
Here’s what they look like:
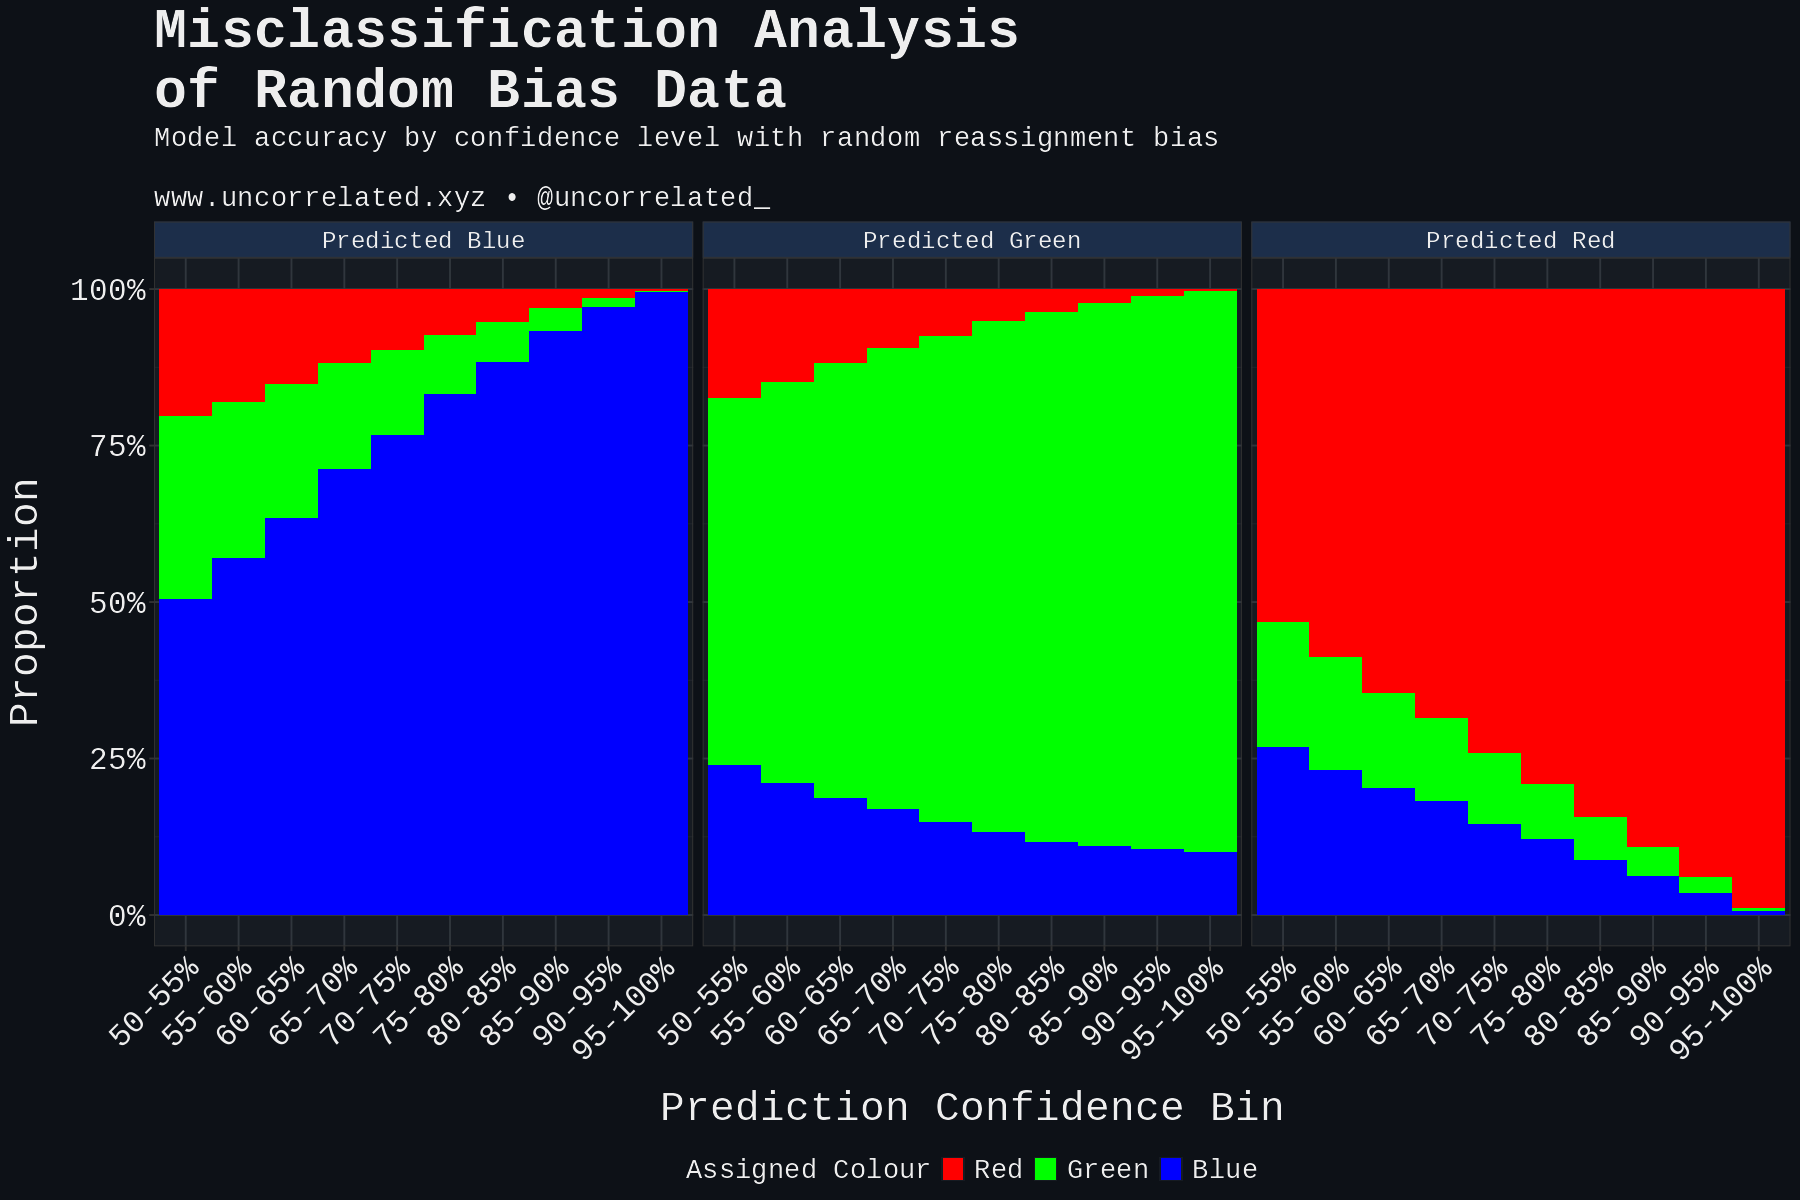
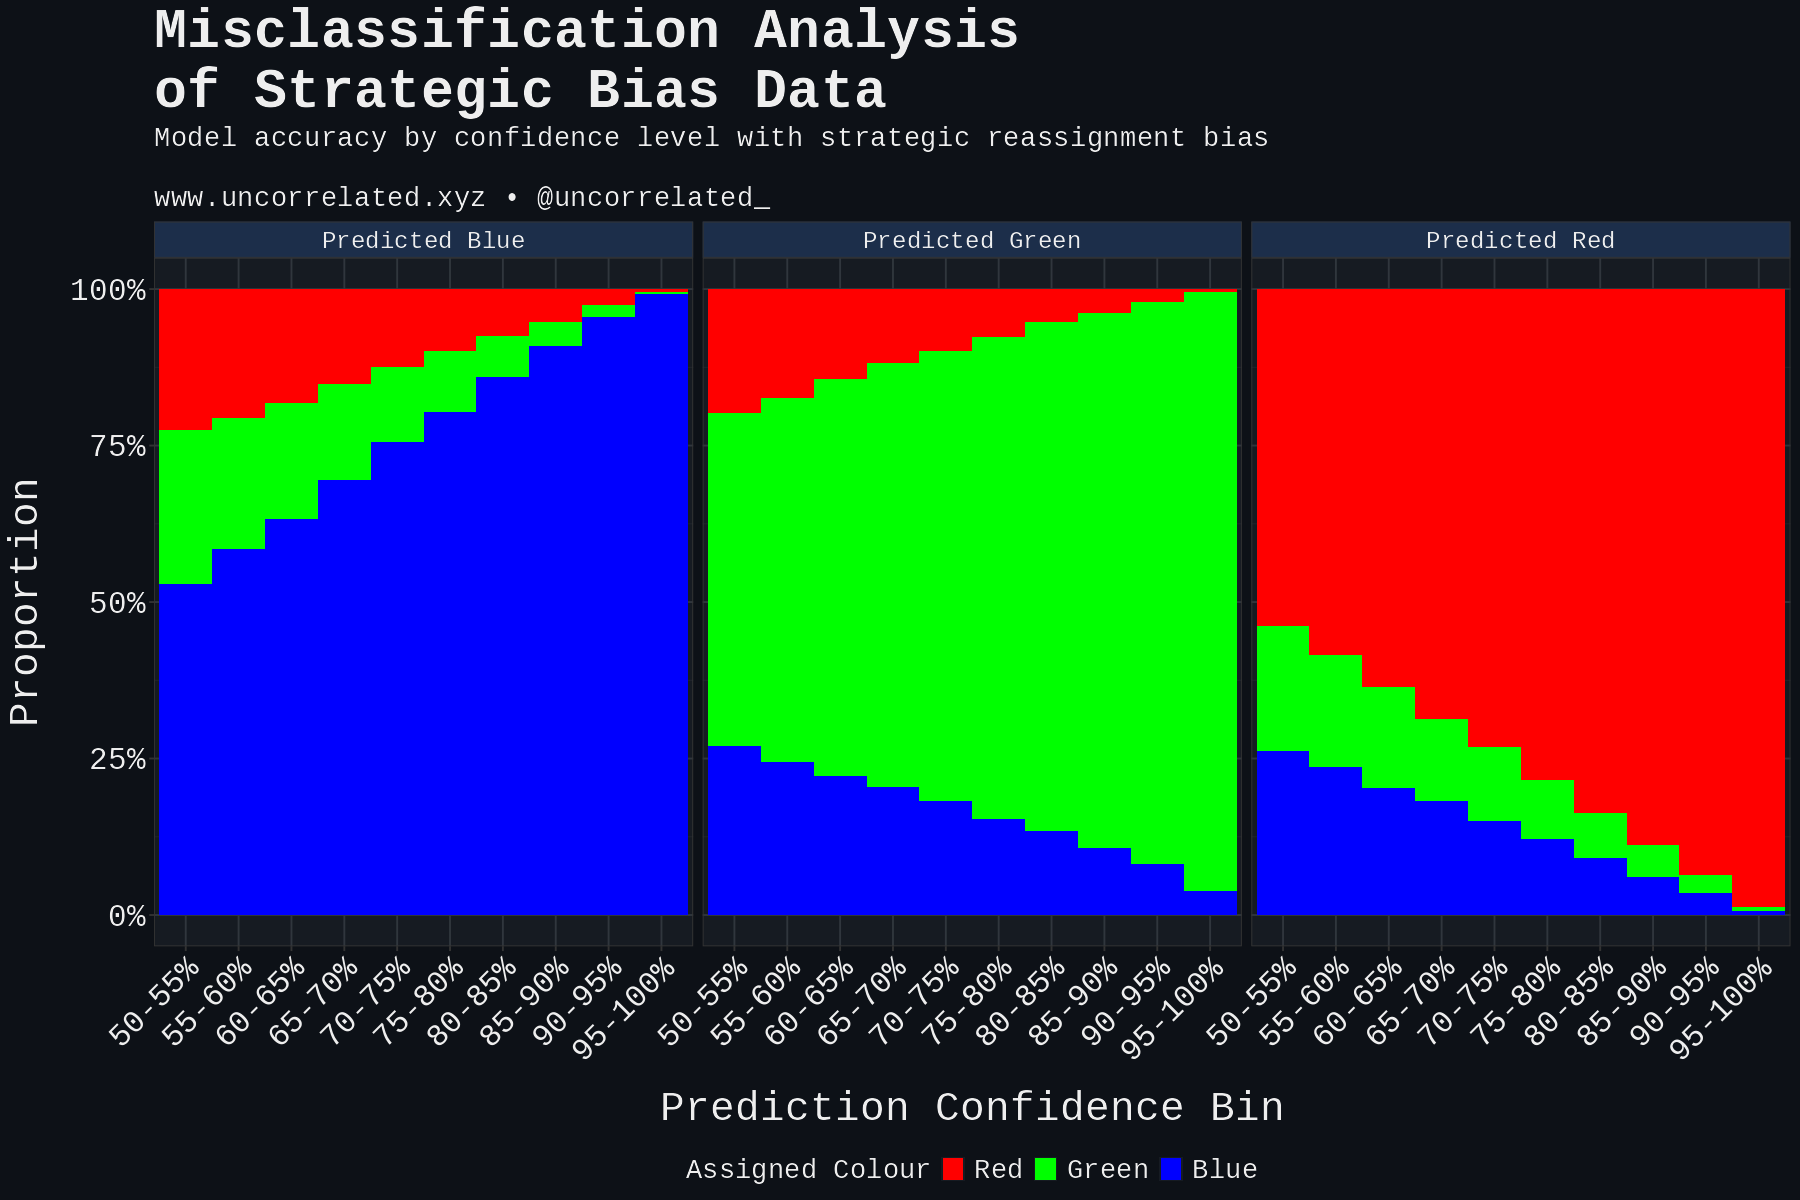
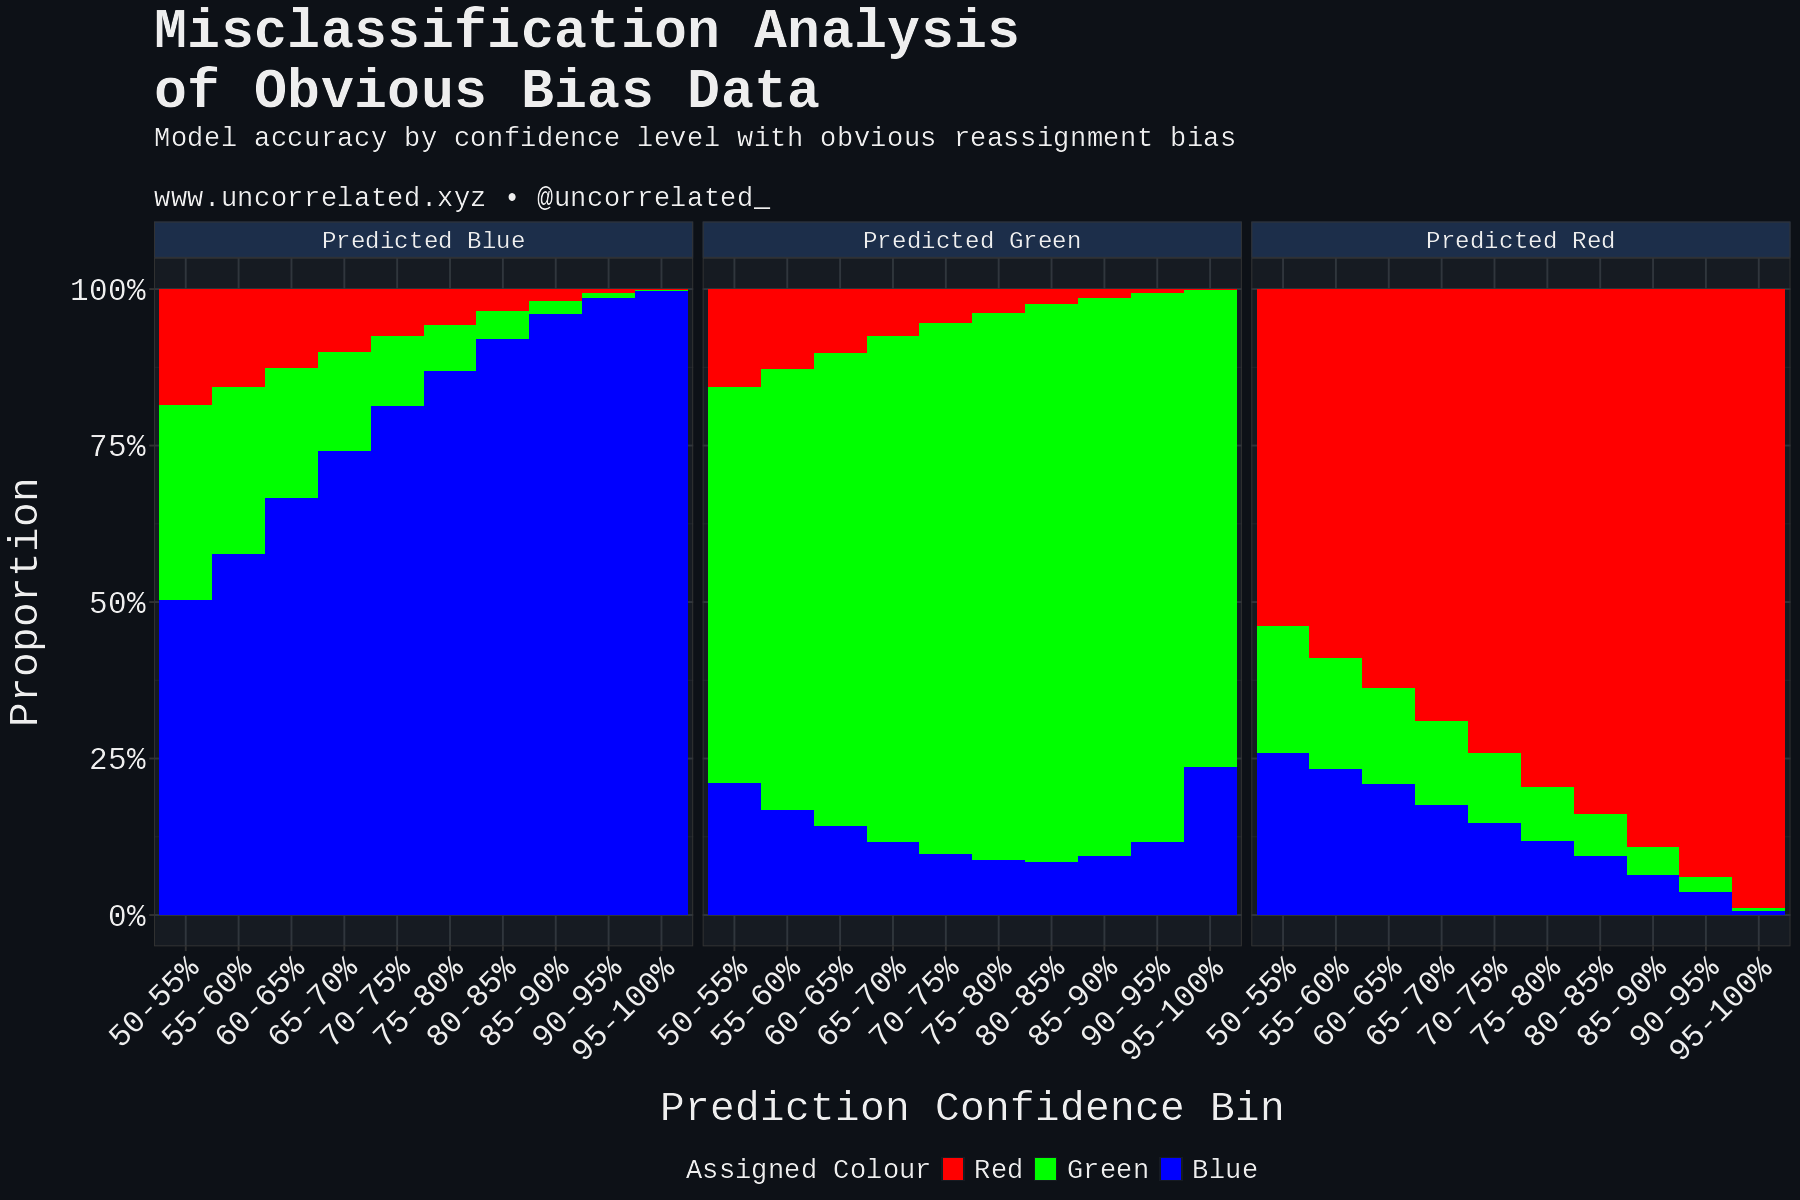
Looking at the results, our real-world results most closely reflect random bias. It has a high resting level of Blues (Whites) misclassified as Greens (Hispanics). It does not resemble obvious bias whatsoever. That is to say, comparing this to our real world data, there isn’t evidence that very obvious Hispanics are being systematically and exclusively assigned as White.
State Level Analyses
Now that we’ve documented bias from the perspective of separability and simulations, where a significant proportion (29%) of predicted Hispanics are being assigned White, we ask what predicts misclassification severity.
First, we look at ideology and variation in misclassification by state.
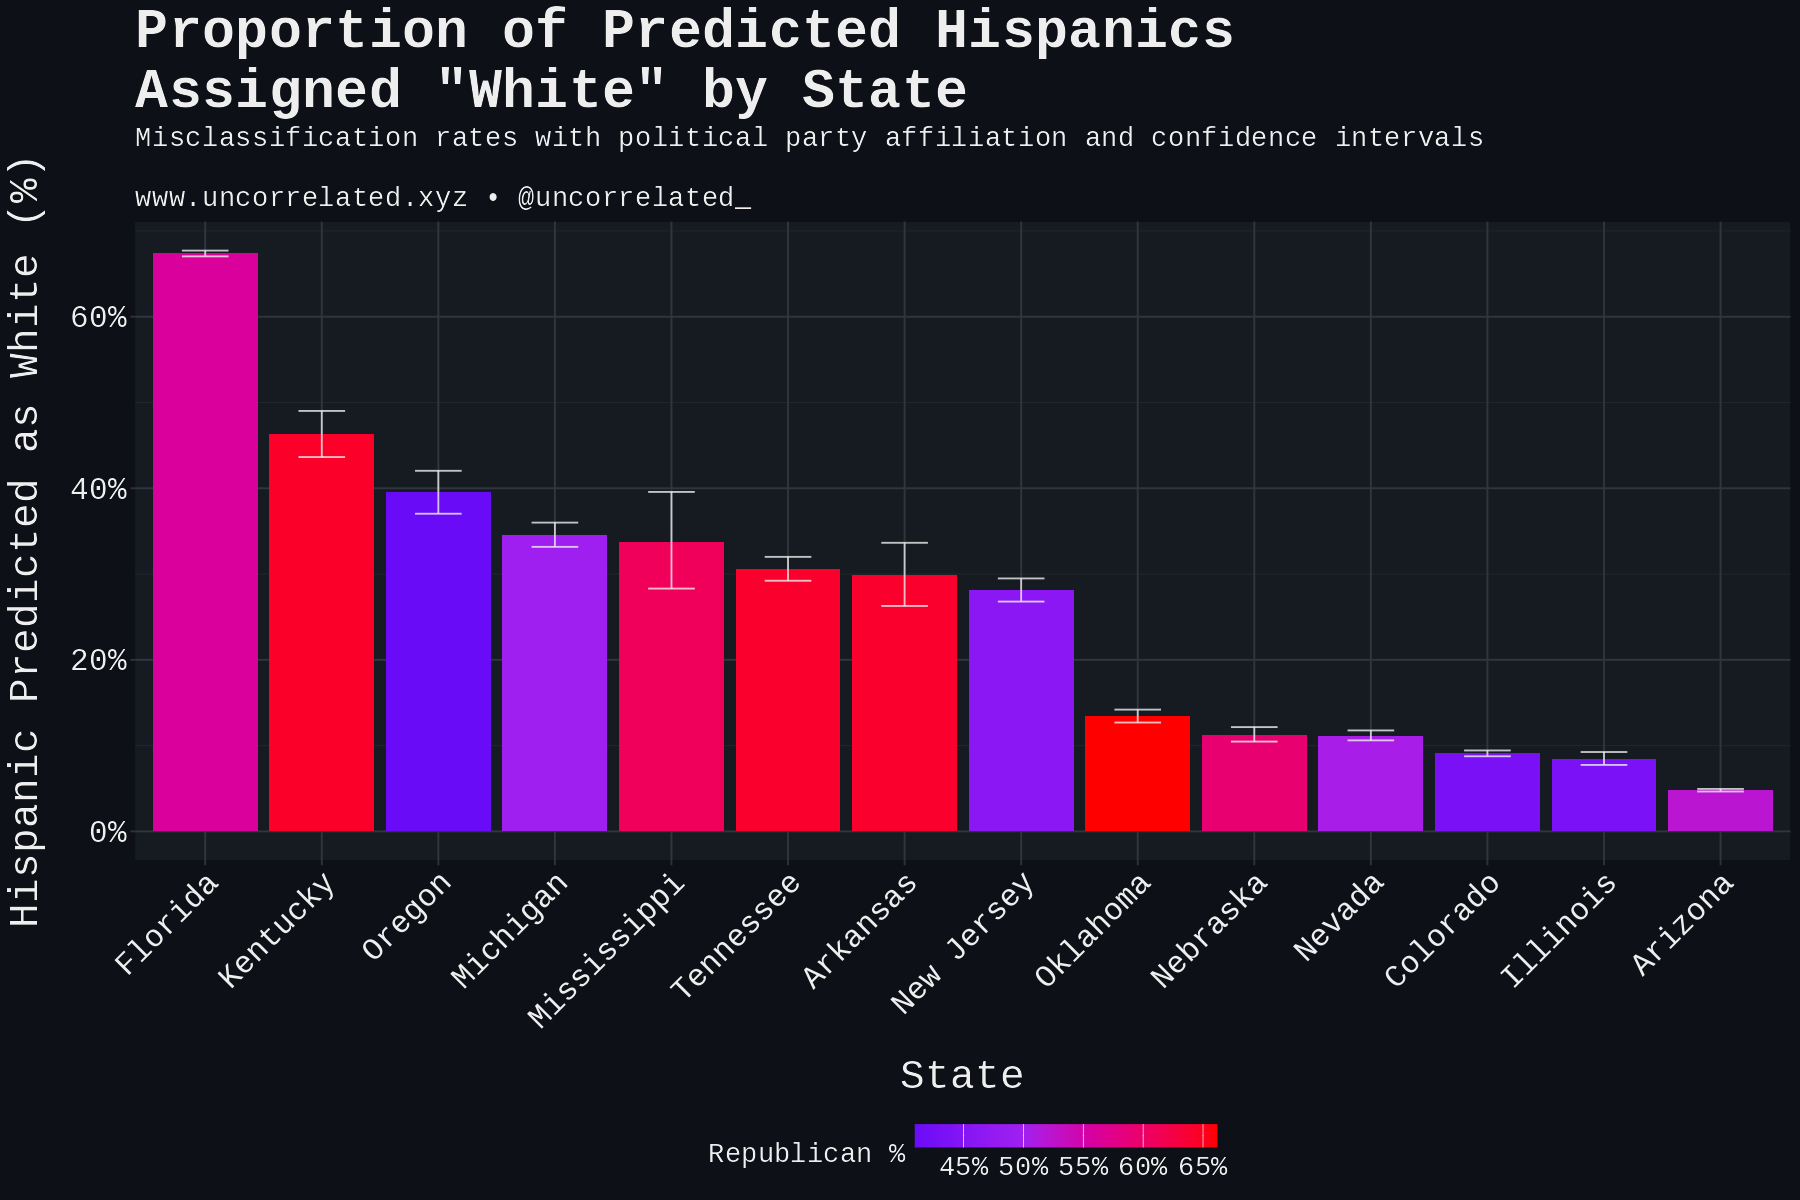
Misclassification of Hispanics as White varies greatly by state. As many as >60% of Hispanics in Florida are being assigned as “White”! This seems incredible.
Digging through the literature, Latino racial self-identification varies substantially by national origin, with research showing approximately 91% of Cuban Americans self-identify as White compared to 56% of Puerto Ricans and 49% of Mexicans (Michael & Timberlake, 2007; Figuereo et al., 2025). Given that Florida has a large Cuban population, it’s possible that this reflects self-identification as White manifesting in official records.
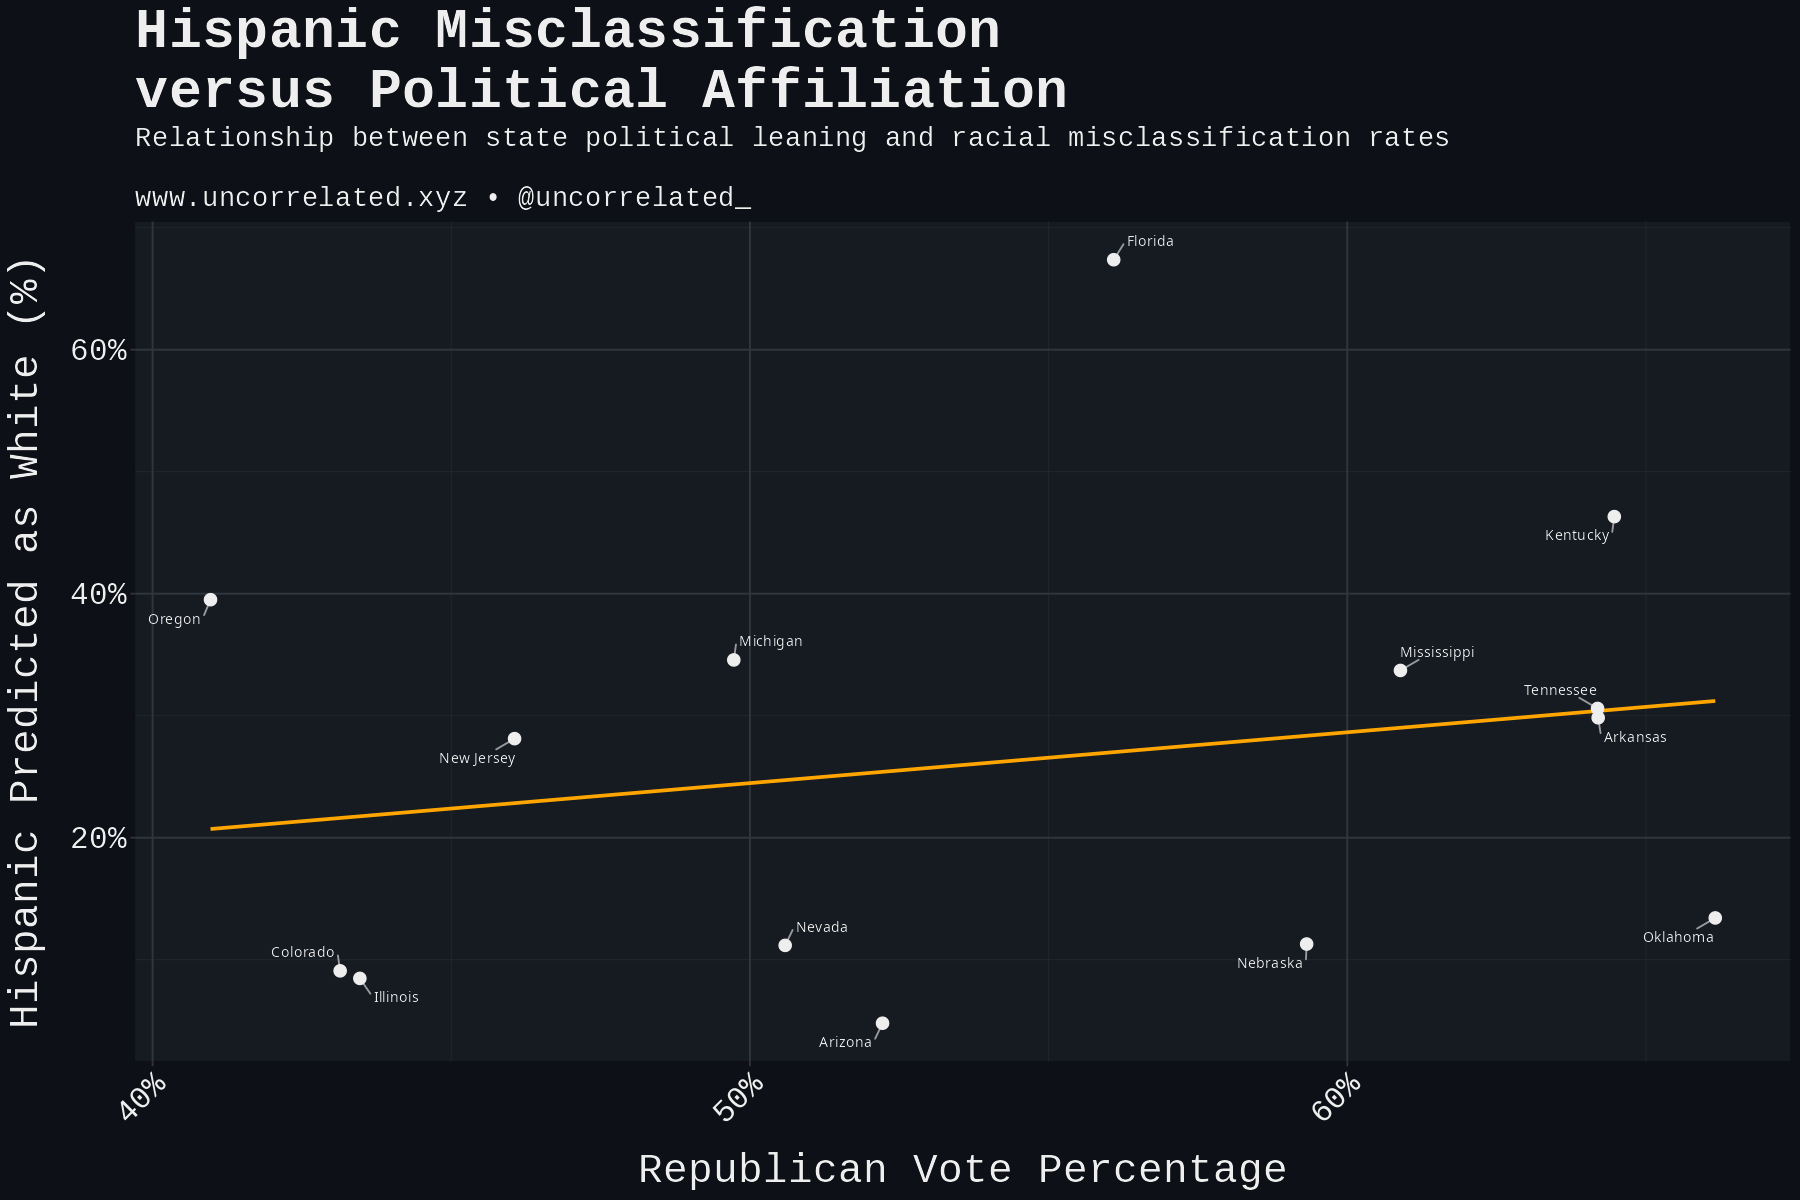
This might explain Florida being an outlier, but what about the other states? We can test for ideology using Republican vote share as a proxy. There is no significant association (r = 0.21, 95% CI: -0.36 to 0.67, p = 0.472). If anything, the above cited research suggested that Latinos were more likely to identify as White when living in Republican areas, although this was only tested on a regional basis. The expected direction here is positive, if there is one at all.
What about genetic similarity between Hispanics and Europeans? Hispanics in states with greater European heritage and less Native American ancestry might be confused with Whites more often. Crucially, we’re not interested in measuring European ancestry among Hispanics, but the distinctive Native American ancestry.
This would have direct causal effects. One might consider that the less distinctive Hispanics become from Europeans (less Native American ancestry), the harder it would be to distinguish them, the more the lines would blur between the ethnicities, commensurately increasing misclassification. We sourced the admixture data by state from Bryc et al. (2015).
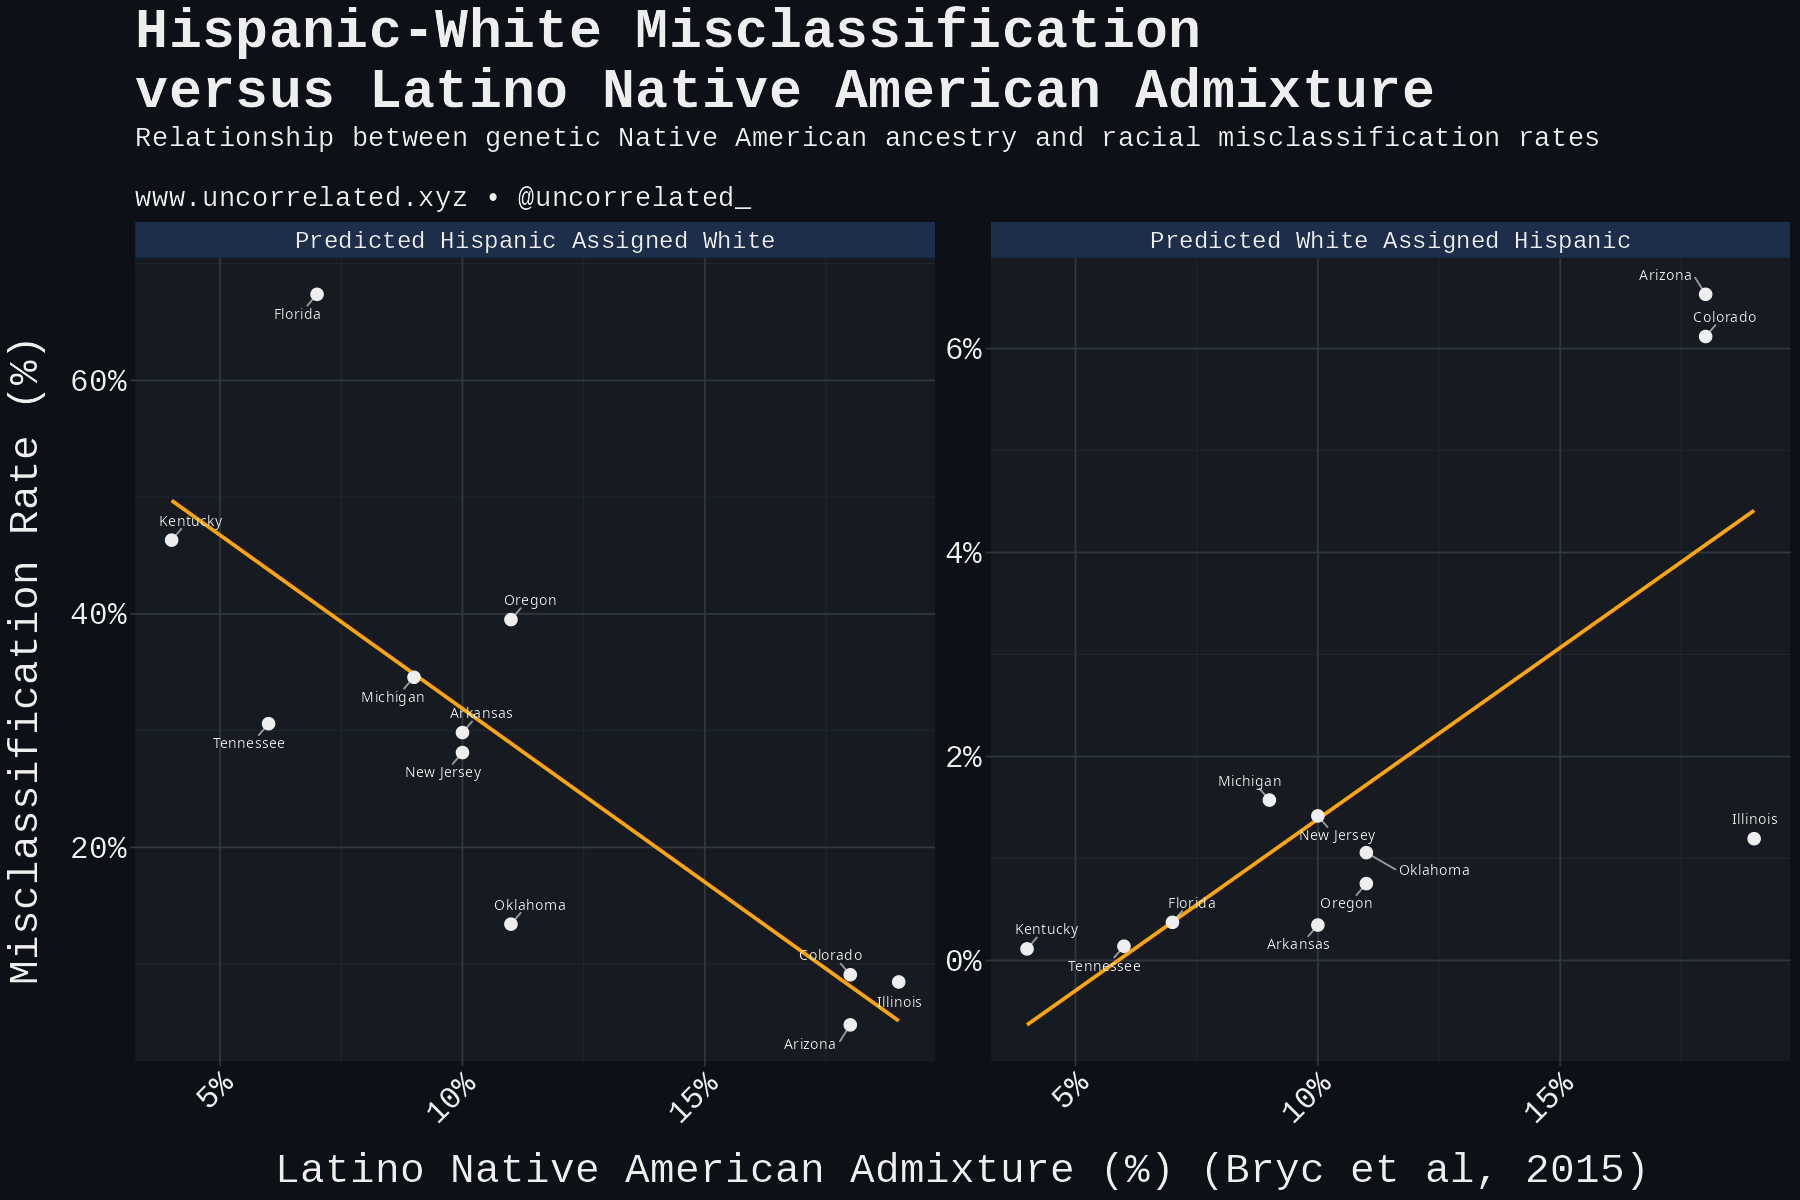
Despite the small sample, it’s statistically significant in two directions: predicted Hispanics assigned White being negatively correlated (r = -0.80, 95% CI: -0.95 to -0.38, p = 0.003, n=11) and predicted Whites assigned Hispanic positively correlated (r = 0.74, 95% CI: 0.26 to 0.93, p = 0.009, n=11).
One could interpret these multiple ways:
- The Boring Interpretation:
The hypothesis is correct. Native American ancestry causes Hispanics to become more distinctive and less likely to be misclassified as White. We can ignore the White-Hispanic correlation because it’s highly leveraged by Arizona and Colorado and the p-value is borderline anyway. This is reinforced by the fact that the ancestry data is based on low-n 23andMe samples, which are unfortunately selected, as it’s plausible that higher SES groups are more likely to use ancestry services, among other reasons.
- The Less Boring Interpretation:
It’s about self-identification, not phenotypic distinctiveness through genetics. As we showed with Cubans in Florida, misclassification occurs when Hispanics relative to other states choose to identify as White despite their surnames, appearance, etc.
Given this premise, we know our model already incorporates phenotypic distinctiveness. It extracts ethnicity from DeepFace, and darker skin among Latinos robustly predicts identifying as such (Michael & Timberlake, 2007; Figuereo et al., 2025). So our model should already control for phenotype, excluding the possibility of inter-state variation in misclassification resulting from appearance deriving from admixture.
Yet Native American ancestry among Latinos does, so the alternate hypothesis is that Hispanic identification is more likely controlling for phenotype and surname where it’s more visible. There could be group effects to Hispanic identity: when it becomes more distinctive and visible, others are more likely to recognize it and identify the same. This would explain why Whites are over-identifying as Hispanic (the positive correlation) and why misclassification of Hispanics as White is rarer (the negative correlation).
So which interpretation is correct?
To test this further, we added state to the MLR classification model as a control for variation in self-identification. If the self-identification hypothesis were correct, adding state should meaningfully improve model performance. State would act as a proxy for regional self-identification norms (Cubans in Florida identifying as White, different patterns in states with varying Native American ancestry), allowing the model to learn state-specific patterns like “in Florida, people with X features are more likely to identify as White.” This should help the model match official classifications better.
However, it did not help. The classification accuracy only increased by ~1% and the mass of Hispanic misclassification remained. This suggests that state-level self-identification patterns aren’t actually explaining the misclassification—if they were, state should have been a powerful predictor.
The data quality is simply not here to say for certain. It should be noted that other combinations of ancestry regressions were insignificant. For example, correlating European ancestry among Latinos to misclassification instead of Native American ancestry. So it’s also possible that this is just noise. Personally I’m biased towards Occam’s razor, the simplest explanation is often the best.
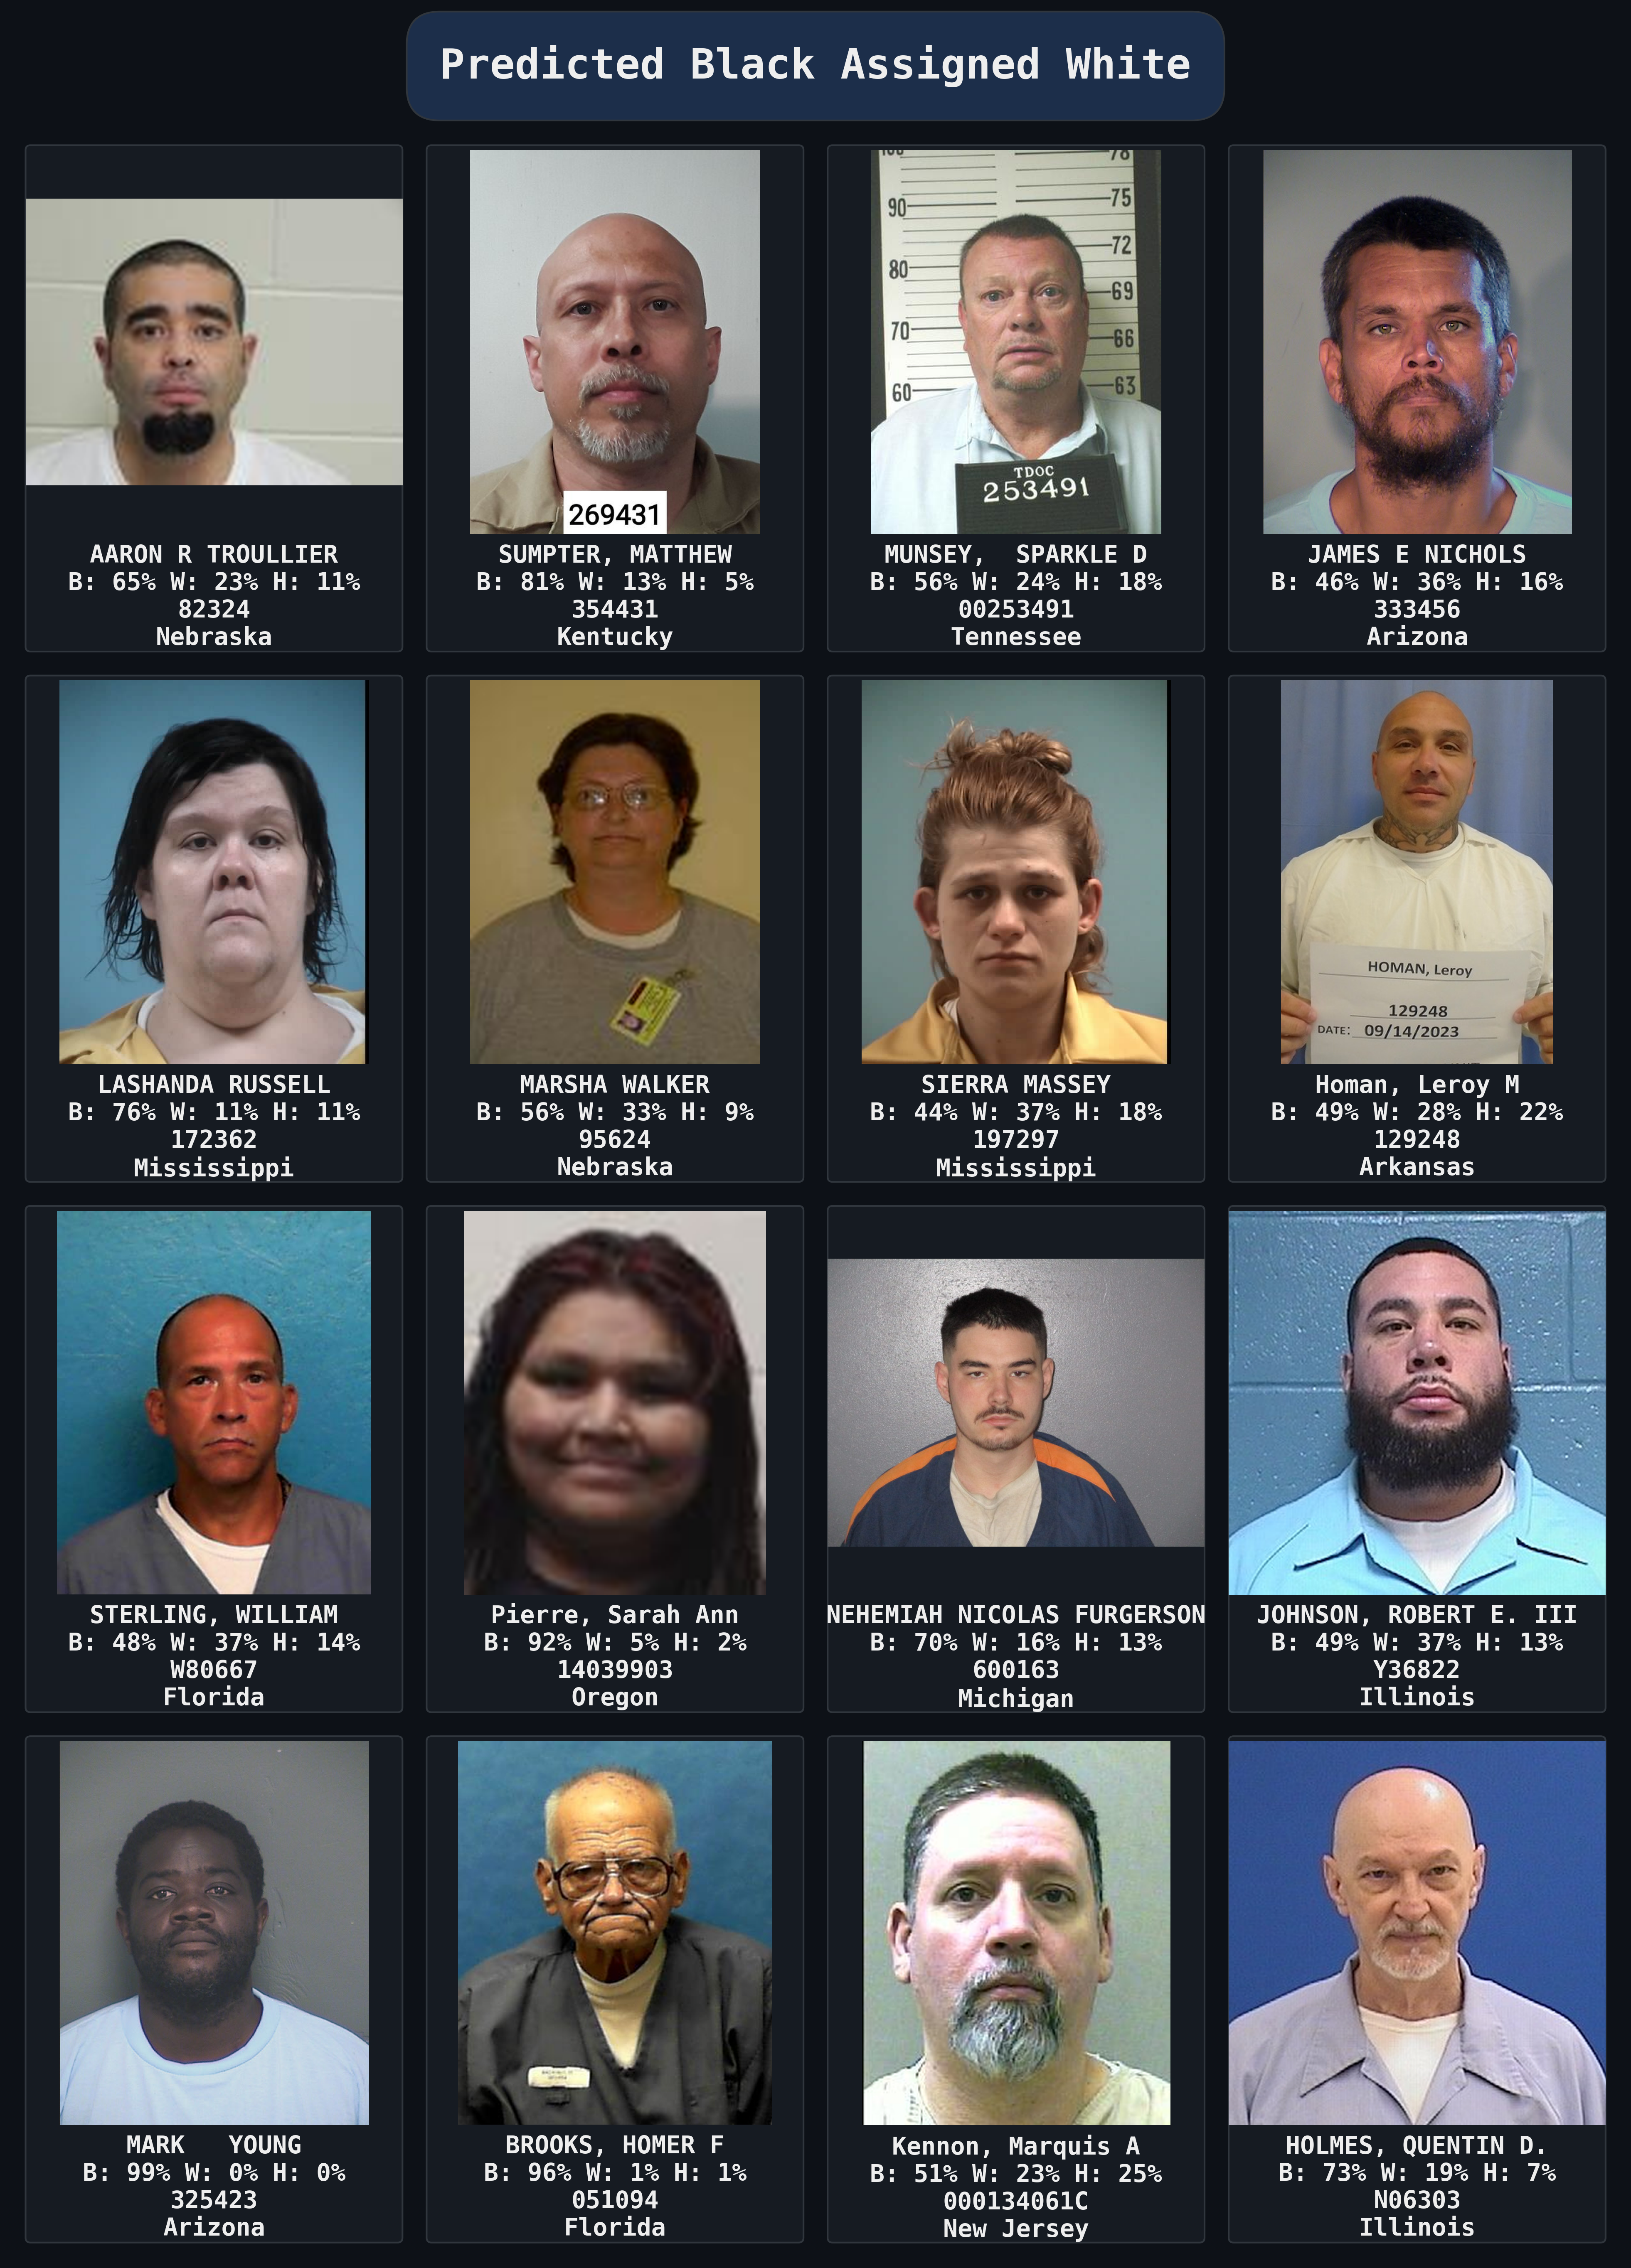
Collages of Mugshots: Individual Inspection
Despite the reservations we have about manual inspection, in the context of our model it’s still worthwhile as it validates our approach visually.
We used Python to randomly and programmatically select and render mugshot collages to verify our approach. First, we inspected low confidence and high confidence predictions. Contrasting these, we found that model confidence was commensurate with the predicted race being the likelier true racial classification, confirming our methodology.
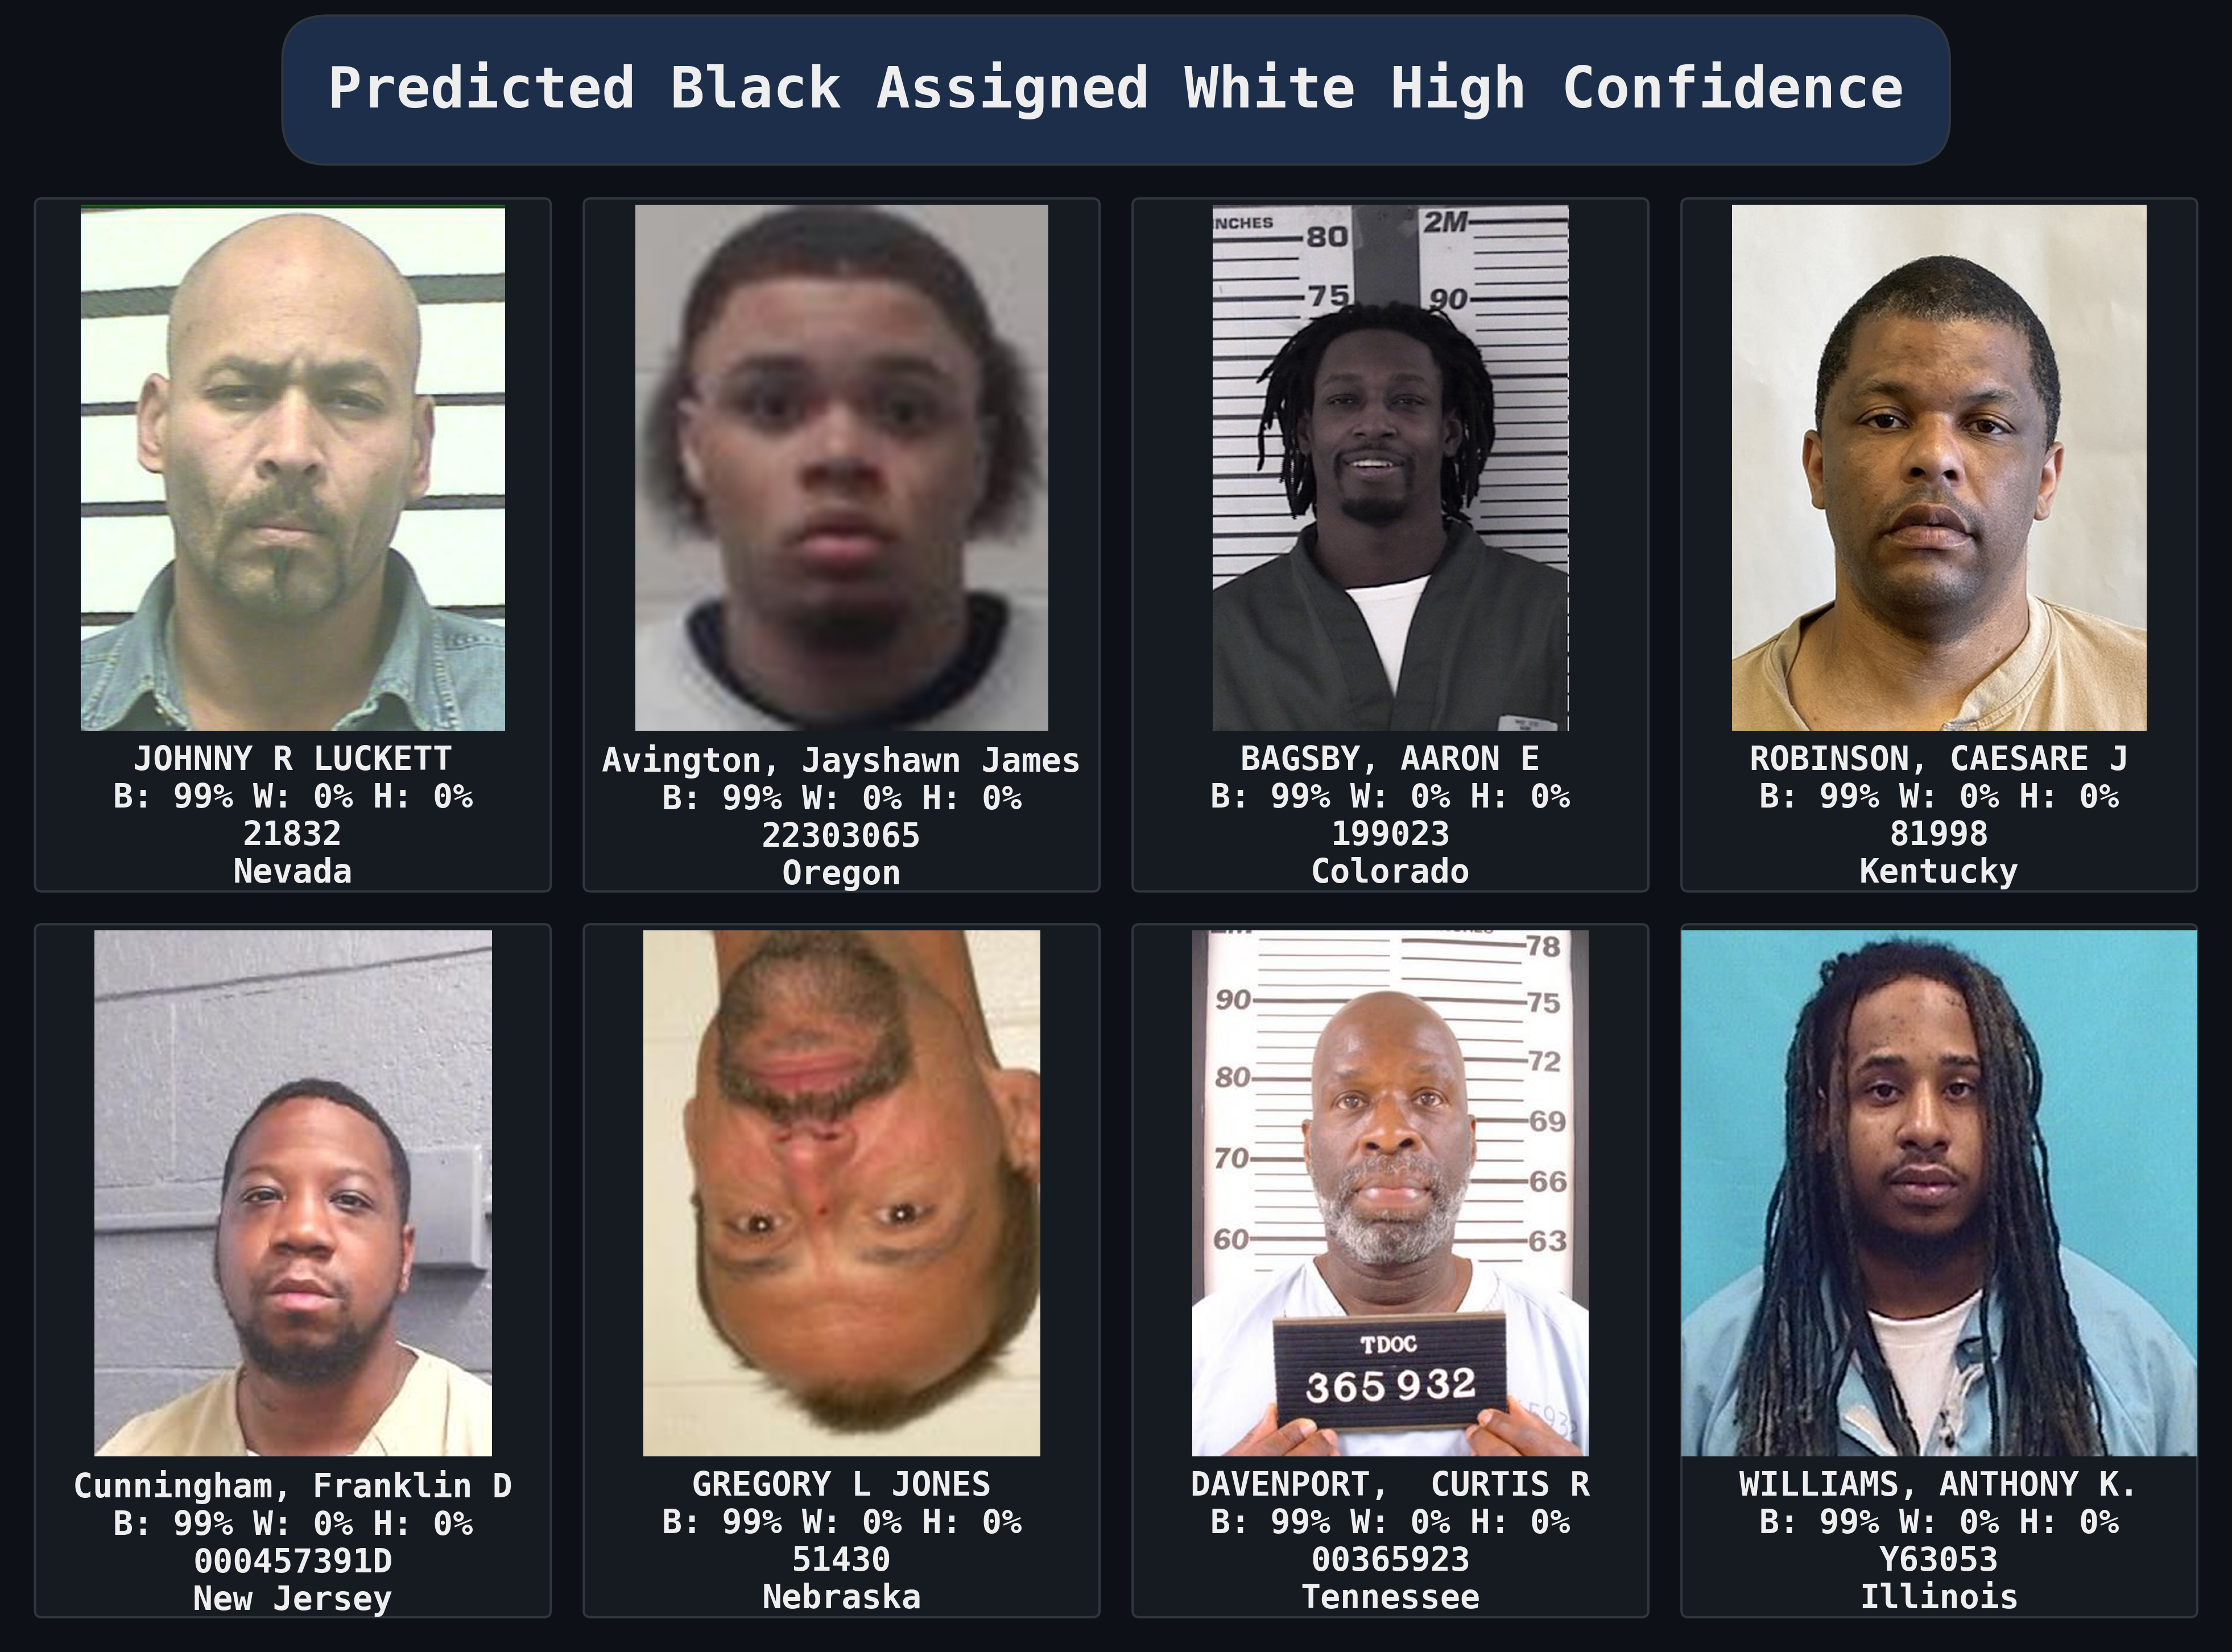
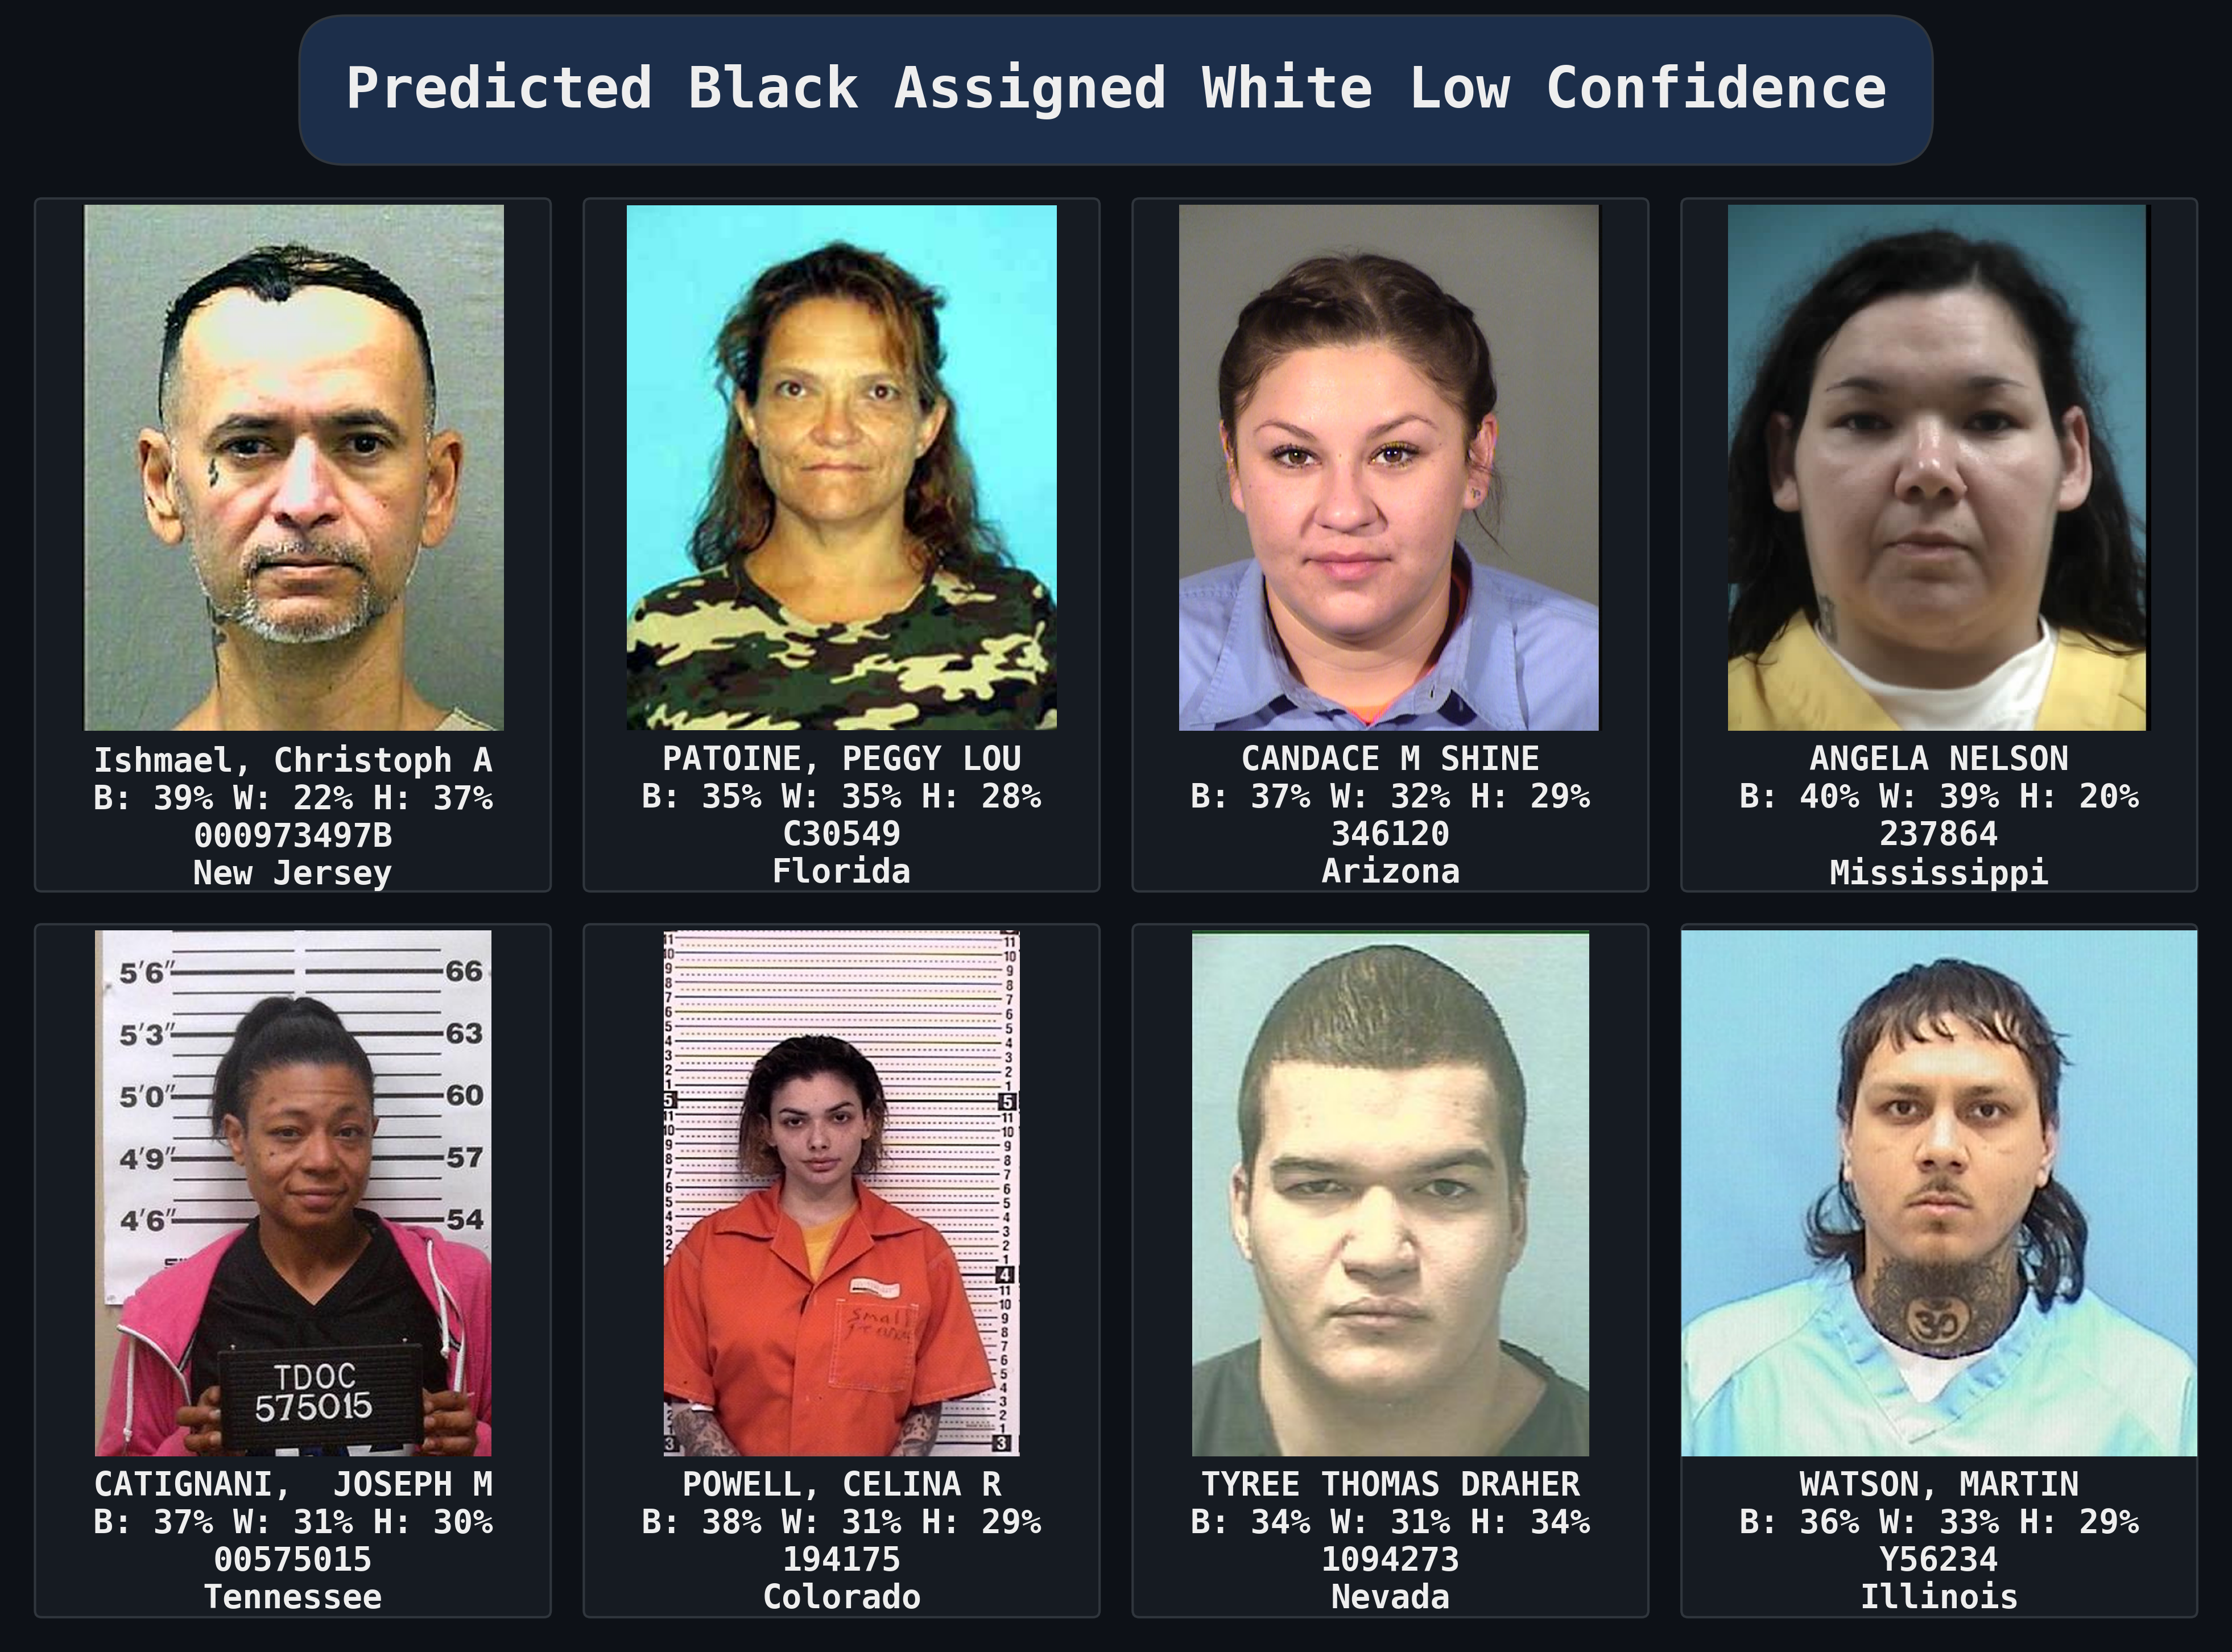
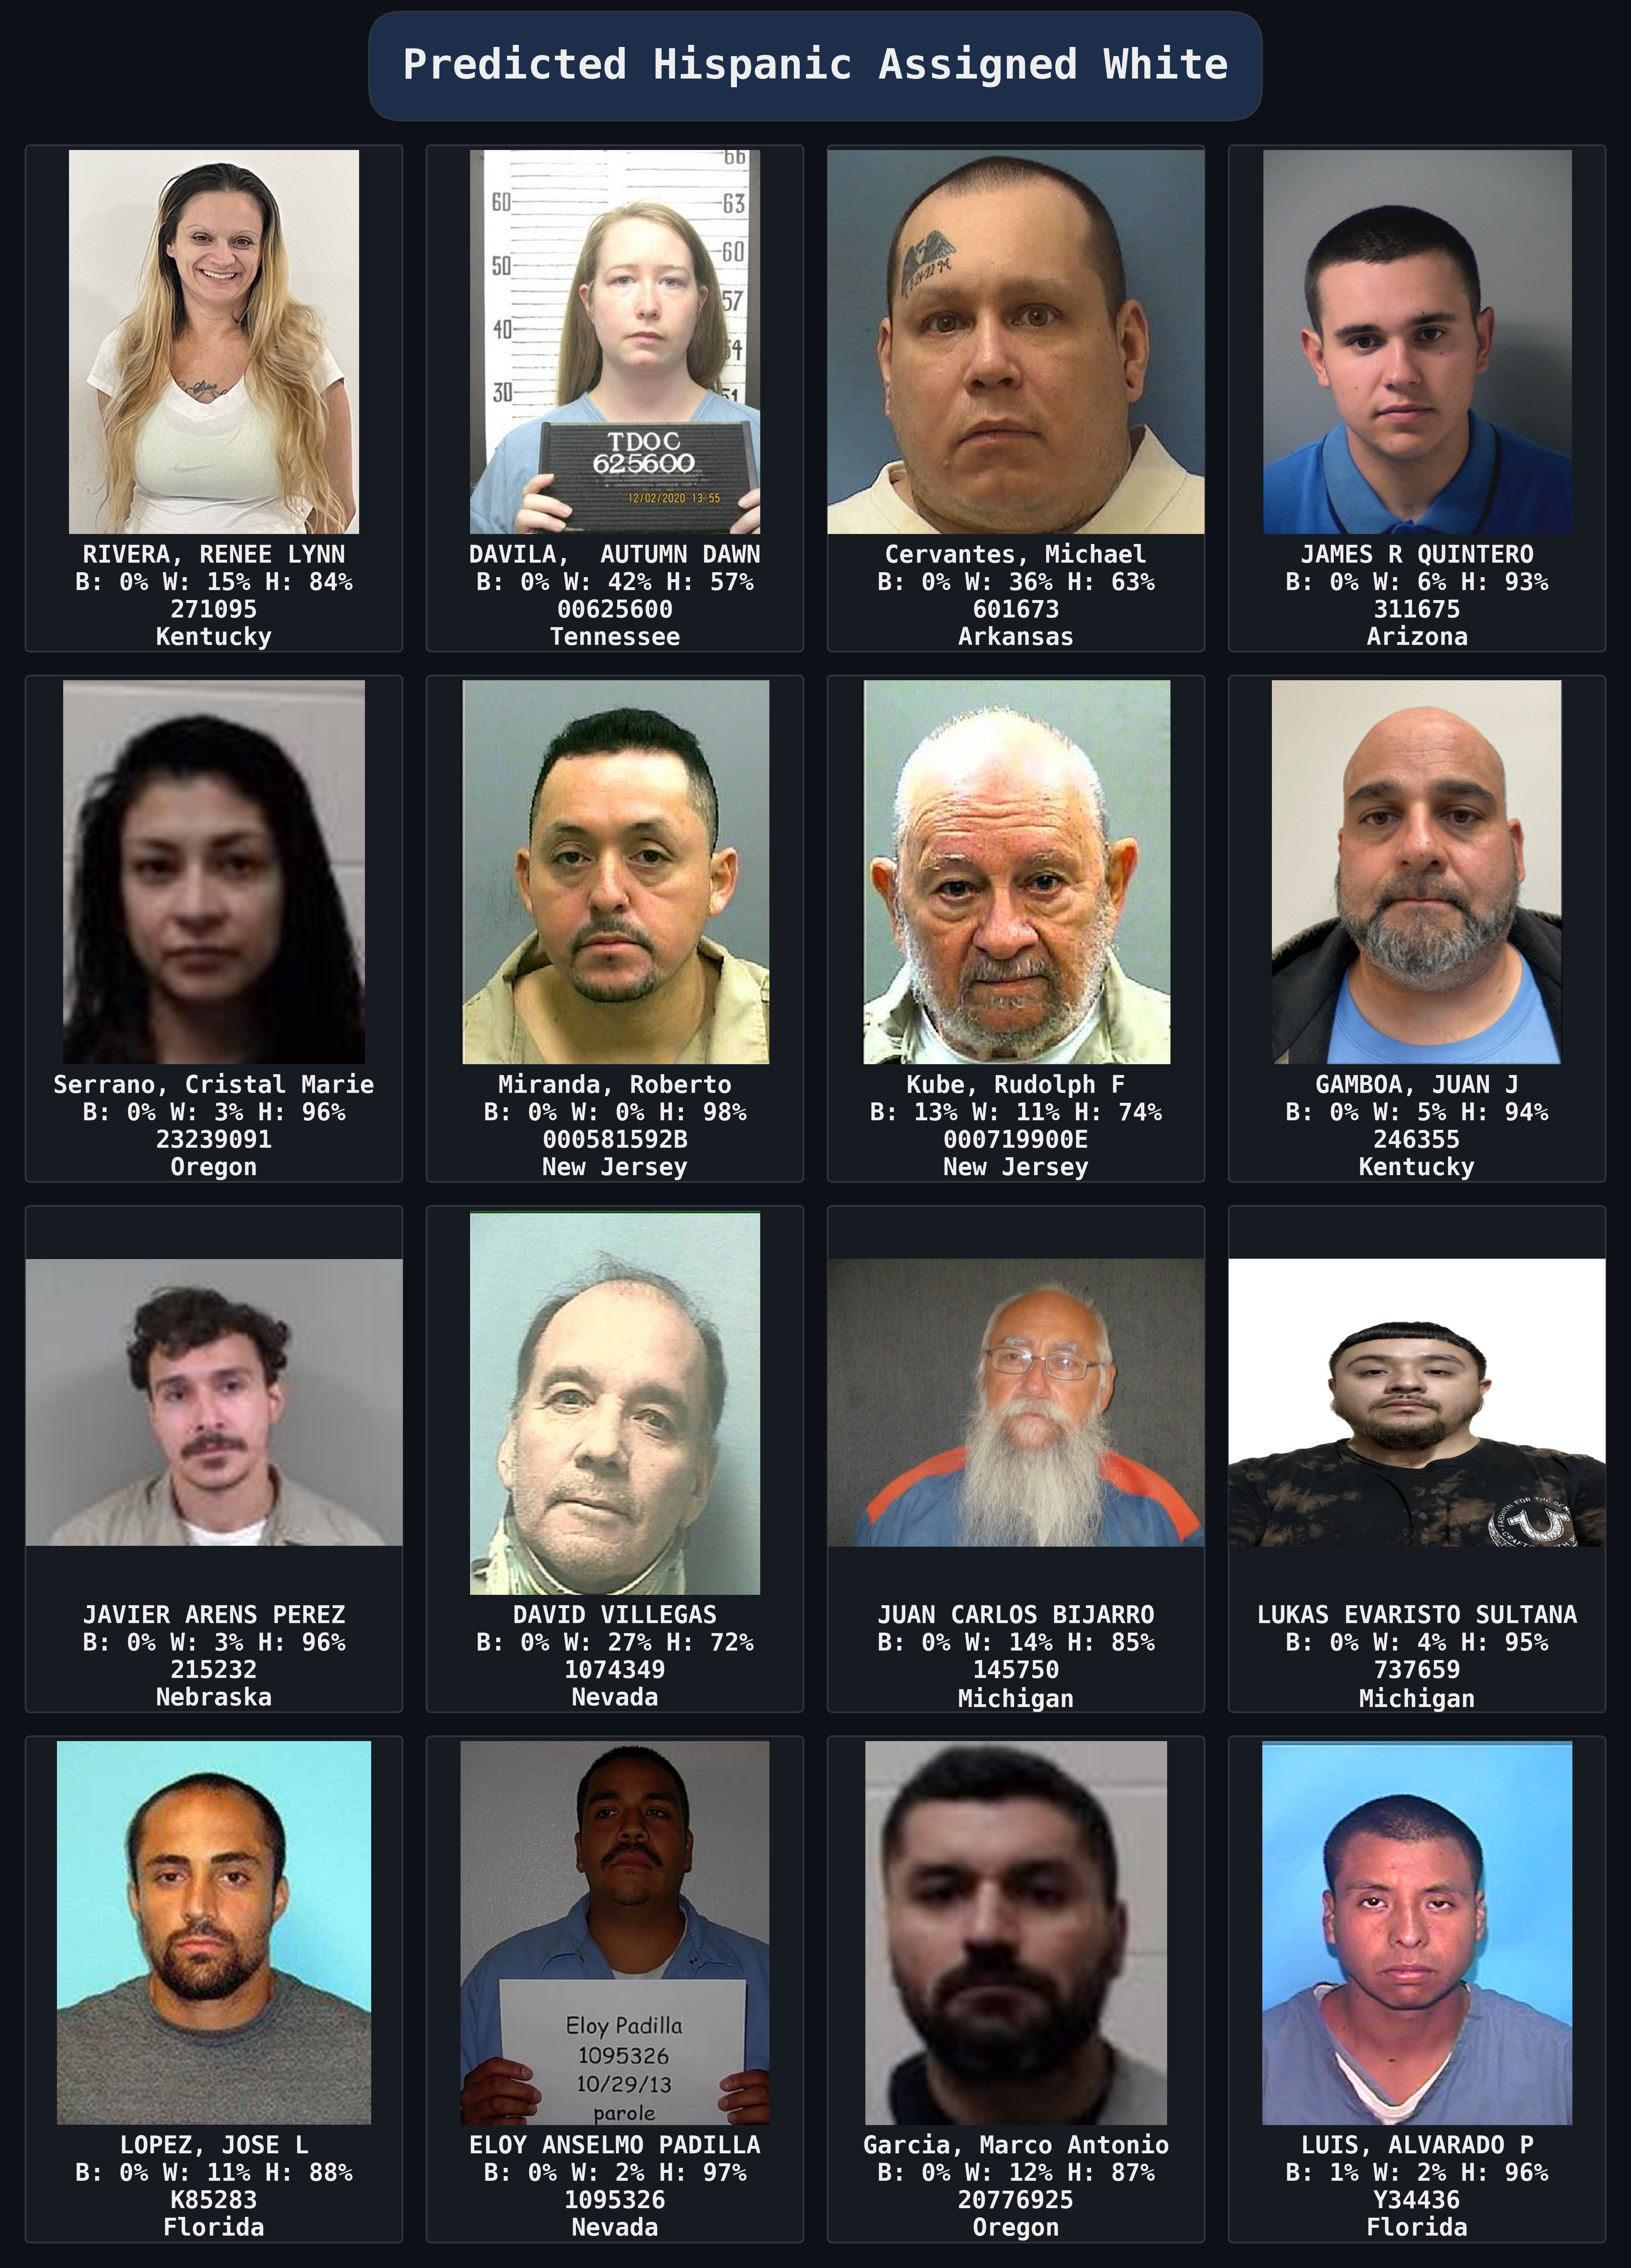
Continuing on, we then generated mugshots for the strongest and weakest misclassification directions: predicted Hispanics assigned “White” and predicted Blacks assigned “White”. The median confidence for predicted Hispanics assigned White was 91%, whereas for predicted Blacks assigned White it’s only 51%.
Observing the two, it is apparent from the surnames and physical appearances that predicted Hispanics are indeed Hispanic instead of White. In contrast, for predicted Blacks assigned White it is clear that the discrepancy between predicted and assigned race results from model error. Once again, this confirms that our methodology is sufficient and that Hispanics assigned White is systematic.
Correcting the Bias: What are the True Crime Rates?
To quantify the impact of racial misclassification on reported criminal record rates, we corrected the assigned racial counts in each state’s criminal database. We calculated DOC criminal records per 100,000 population using census data, normalizing all rates relative to the assigned White rate within each state.
We applied two corrections:
First, a high-confidence correction. We assumed that the predicted race was the true race where the model classified with >90% confidence; for cases where model confidence was <90%, the assumed race was the assigned race. Second, a more generous reclassification. We assumed that the predicted race reflected the true race rather than the assigned race for all cases. One can see the results by state and race.
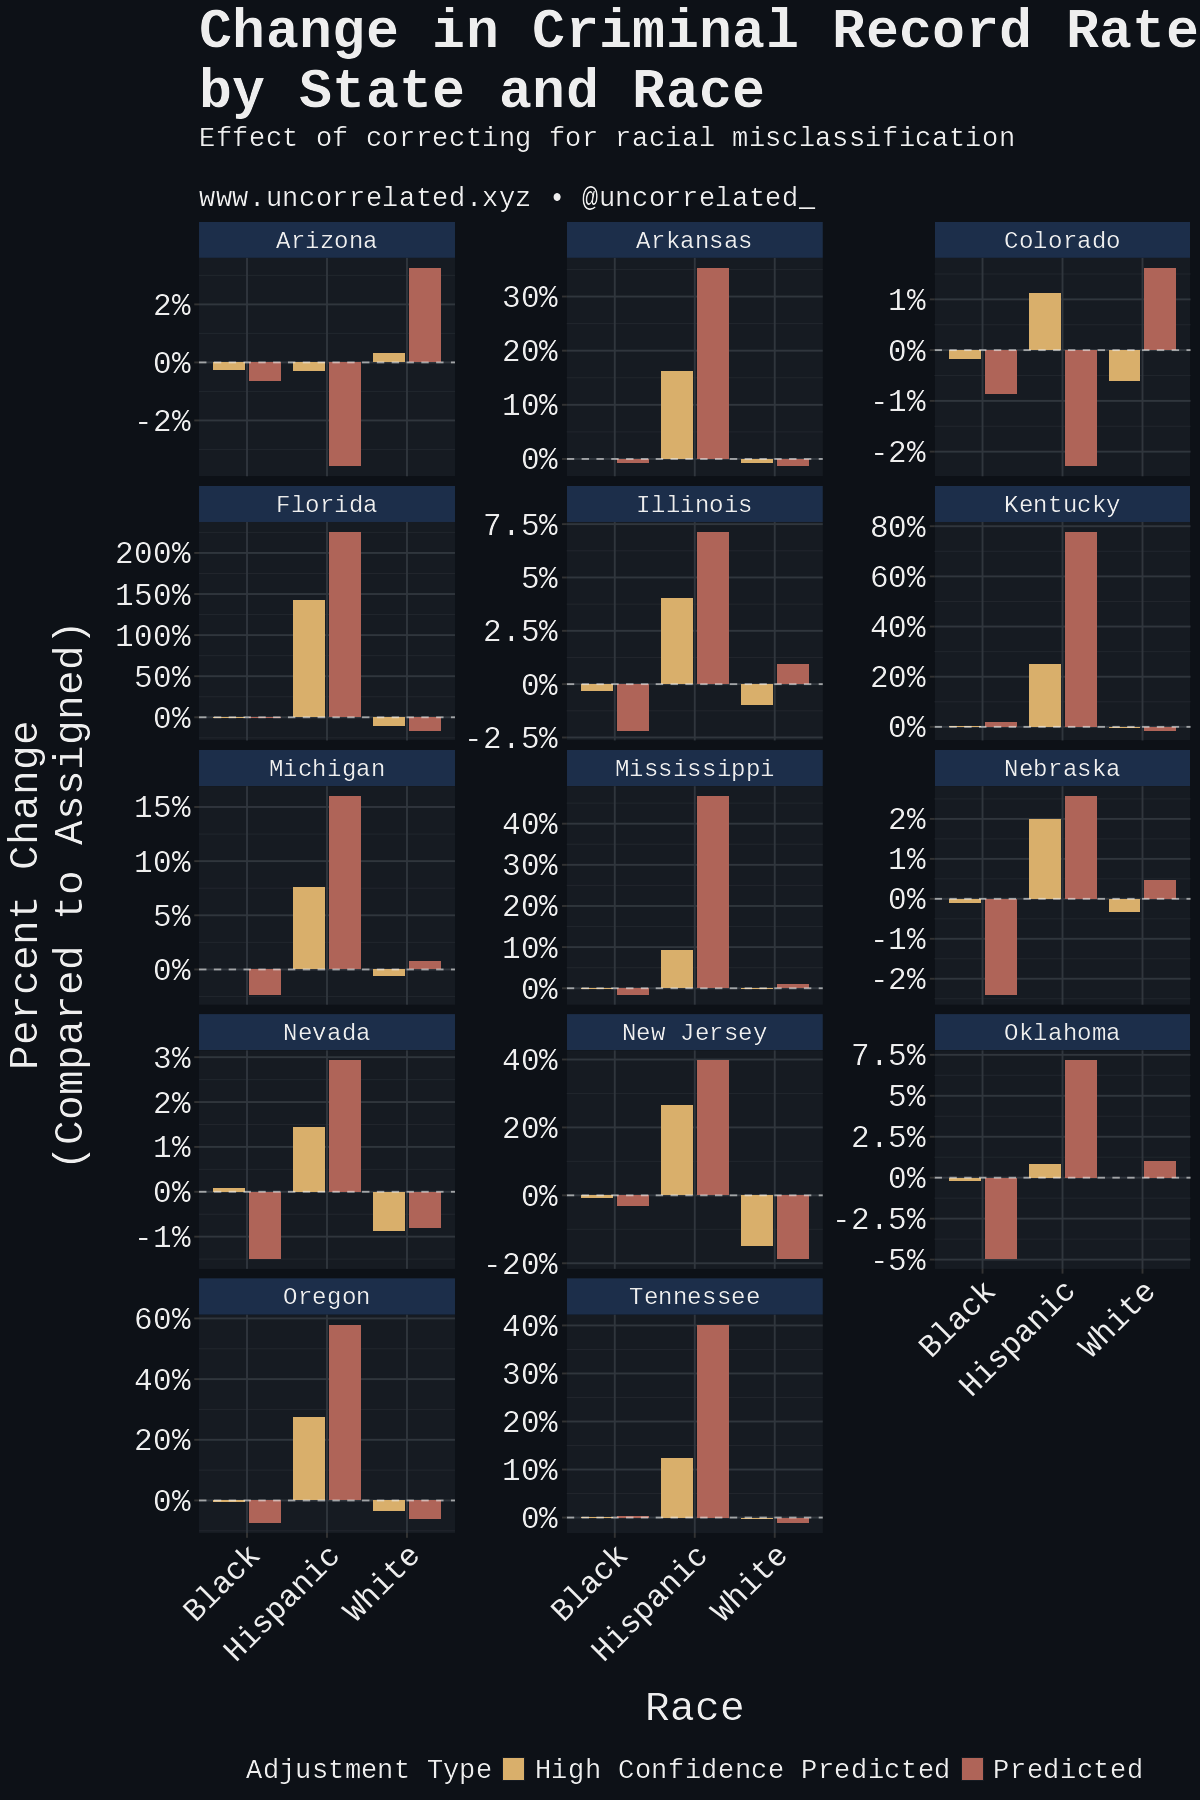
Overall, the second adjustment correcting for misclassification increases Hispanic criminal record rates by 31% among the states analyzed while decreasing Black rates by 1% and White rates by 6%.
The high-confidence adjustment was more modest. Hispanic criminal record rates still increased by 20%, however Black criminal rates only fell an indistinguishable 0.2%, and White rates fell by 4%. The figure below shows the combined criminal record rate adjustment by state and overall.
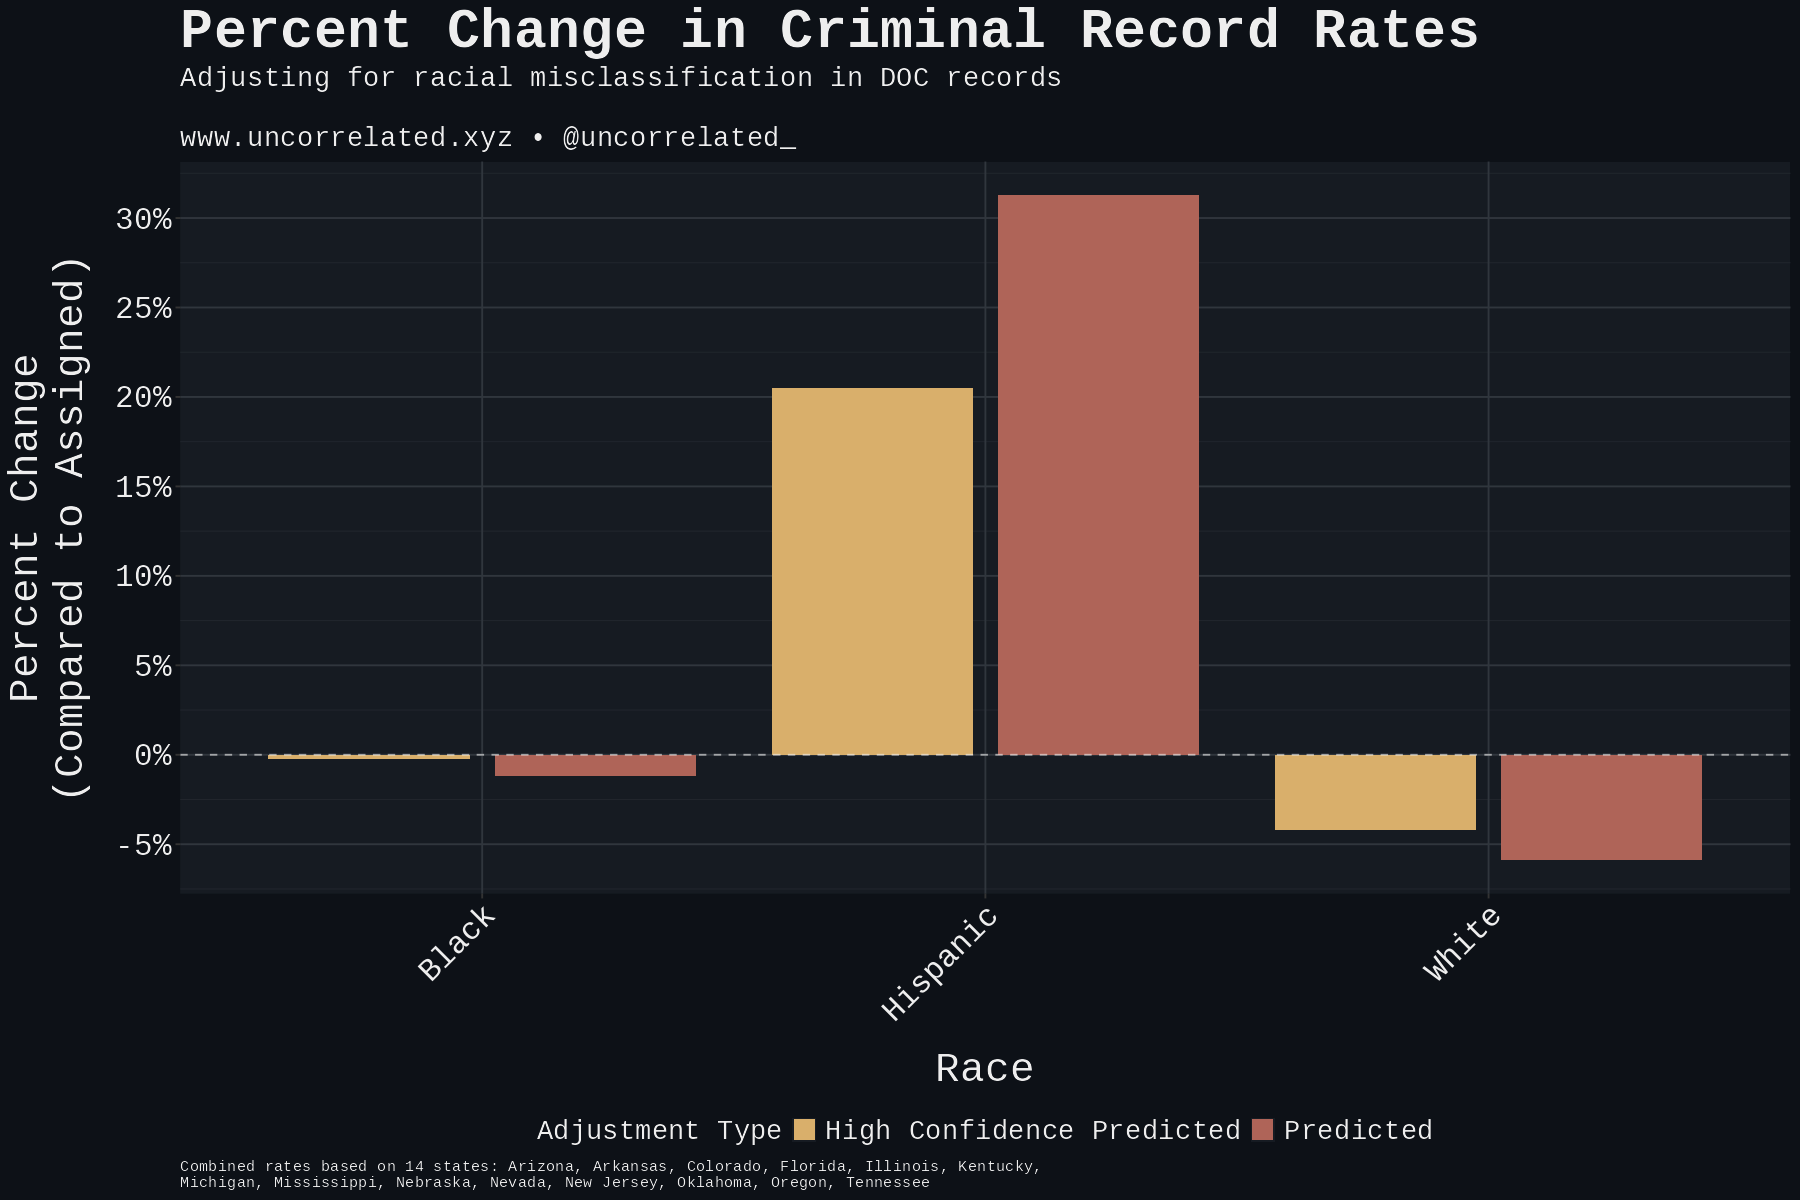
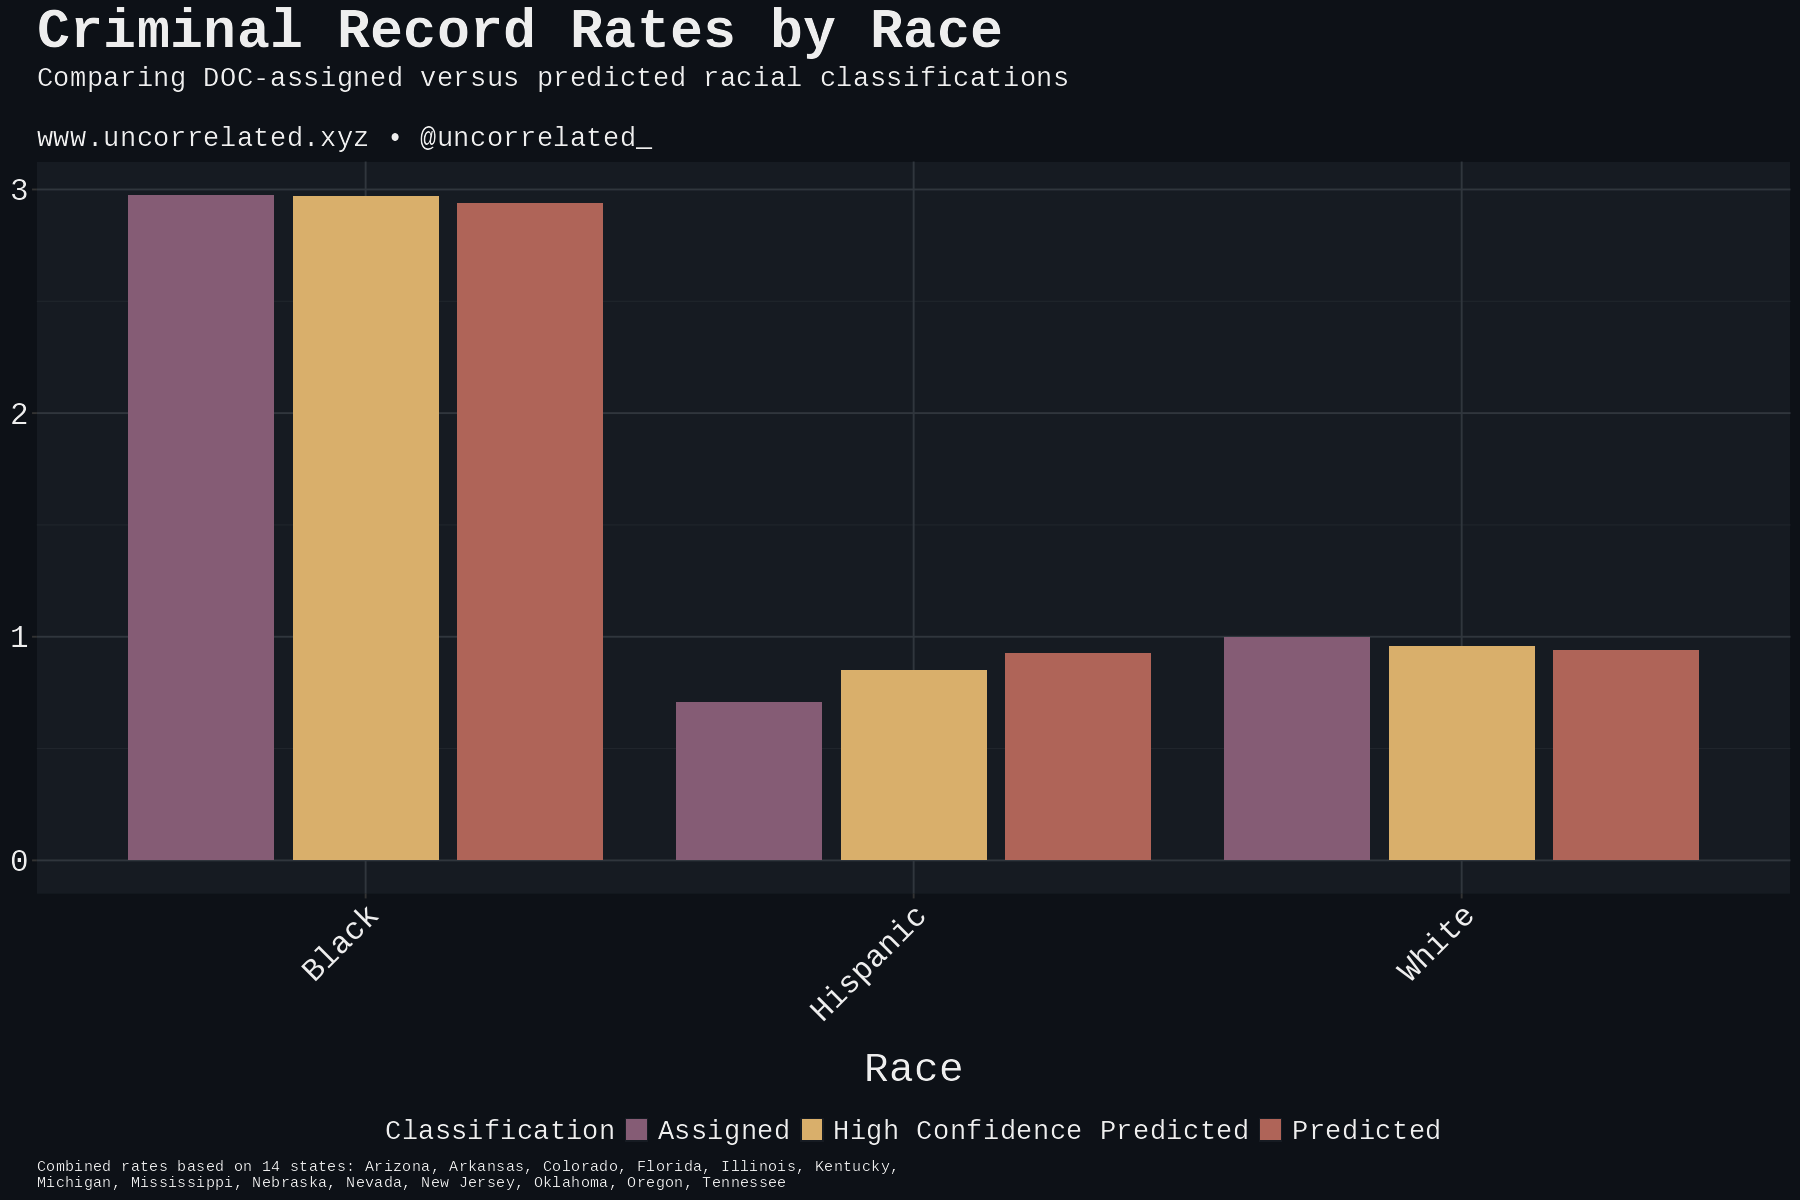
How does this affect the overall rates? Since we’re working with criminal records of individuals that vary by state, not incarceration rates, we normalized the assigned White rate to 1 as a reference point. Post-adjustment, White and Hispanic criminal record rates converge.
These are not to be interpreted as crime rates—these are changes in the rate of records for all states combined. These records stretch back decades when the population composition was different, which would affect the denominator in this calculation. This is the reality of the data we’re working with. This is why the adjustments were visualized first to avoid confusion.
These results demonstrate that racial misclassification in criminal databases artificially deflates Hispanic criminal record rates while mildly inflating White rates. The magnitude of the effect is substantial: the corrected Hispanic rate is 20% higher even in the conservative case.
Conclusion
Four findings support genuine Hispanic-to-White misclassification rather than model error:
-
Visual inspection of high-confidence cases showed individuals with Hispanic phenotypes and surnames despite White classifications.
-
Principal component analysis revealed a separability paradox: Whites and Hispanics showed greater Euclidean distance (4.53) than Whites and Blacks (3.41) in PC space, yet Hispanics were misclassified as White at high rates while Blacks were not. While PCA separability differs from predictive separability, this pattern contradicts explanations based solely on phenotypic similarity. Additionally, Whites were distributed throughout the Hispanic region in PC space, but Hispanics were not distributed throughout the White region, suggesting that individuals classified as White within Hispanic PC space represent misclassified Hispanics.
-
Model confidence predicted accuracy for Black and White classifications: as confidence approached 100%, accuracy approached 100%. For Hispanic predictions, this relationship broke down. At 95-100% confidence, 22.4% of predicted Hispanics were still assigned as White. This pattern was asymmetric, occurring only for Hispanic-to-White misclassification at high rates (>20% in most states), not for other racial combinations. When we simulated datasets with known random label bias (randomly reassigning 10% of one group to another), models trained on the biased labels reproduced this exact pattern: normal confidence-accuracy relationships for unbiased groups, but a high error ceiling equal to the bias prevalence for the biased group. The real-world data showed the same signature, indicating label bias rather than model limitations. This pattern was not an artifact of class imbalance (more Whites than Hispanics in the dataset) because we used inverse frequency weighting to ensure the model optimized for balanced performance across all racial groups.
-
Simulations aligned with what we found: a random distribution of assignments of Whites (Blues) in the Hispanic space (Greens).
The viral posts were right that Hispanics are being misclassified as White in criminal records—29% of them, in fact. But the misclassification appears random rather than deliberate. State-level patterns show no correlation with political ideology, and the distribution matches what we’d expect from administrative error rather than systematic bias. Correcting for this increases Hispanic criminal record rates by 20-31% and decreases White rates by 6%, narrowing the gap between the two considerably. The anecdotal collages got people asking the right question. We just needed 1.5 million records and a multinomial logistic regression to answer it.
Want to Replicate: Open Science Framework, Open Data, and Repository
OSF
OSF all the supplementary materials here:
-
Copy of the article in paper format. It has more academic language and is slightly more comprehensive.
-
The GitHub repository as a .zip
-
The full dataset as a .zip excluding mugshots (as these are hundreds of GBs).
GitHub
The GitHub repository containing the code generating this full analysis is open source. To run this repository with the data below, you’ll need to access the data (on OSF), download it, unzip it in the same folder/directory, start the Python environment, install dependencies if you haven’t (R and its packages), then run ./replicate.sh. There’s a README.md you can follow.
References
- Akiba, T., Sano, S., Yanase, T., Ohta, T., & Koyama, M. (2019). Optuna: A next-generation hyperparameter optimization framework. *Proceedings of the 25th ACM SIGKDD International Conference on Knowledge Discovery and Data Mining*. https://optuna.org/
- Averages. (2023, November 6). Do minorities get longer sentences? An analysis of every state. *The Law of Averages Blog*. https://thelawofaveragesblog.wordpress.com/2023/11/06/do-minorities-get-longer-sentences-an-analysis-of-every-state/
- Beaver, K. M., DeLisi, M., Wright, J. P., Boutwell, B. B., Barnes, J. C., & Vaughn, M. G. (2013). No evidence of racial discrimination in criminal justice processing: Results from the National Longitudinal Study of Adolescent Health. *Personality and Individual Differences*, *55*(1), 29-34. https://doi.org/10.1016/j.paid.2013.01.020
- Beck, A. J. (2021). *Race and ethnicity of violent crime offenders and arrestees, 2018* (NCJ 255969). Bureau of Justice Statistics. https://bjs.ojp.gov/content/pub/pdf/revcoa18.pdf
- Bryc, K., Durand, E. Y., Macpherson, J. M., Reich, D., & Mountain, J. L. (2015). The genetic ancestry of African Americans, Latinos, and European Americans across the United States. *American Journal of Human Genetics*, *96*(1), 37-53. https://doi.org/10.1016/j.ajhg.2014.11.010
- Cesario, J., Johnson, D. J., & Terrill, W. (2019). Is there evidence of racial disparity in police use of deadly force? Analyses of officer-involved fatal shootings in 2015–2016. *Social Psychological and Personality Science*, *10*(5), 586-595. https://doi.org/10.1177/1948550618775108
- D’Alessio, S. J., & Stolzenberg, L. (2003). Race and the probability of arrest. *Social Forces*, *81*(4), 1381-1397. https://doi.org/10.1353/sof.2003.0051
- Figuereo, V., Rosales, R., Takeuchi, D. T., & Calvo, R. (2025). What race am I? Factors associated with racial self-classification among U.S. Latinx adults. *Du Bois Review: Social Science Research on Race*, *22*(2), 215-236. https://doi.org/10.1017/S1742058X25000050
- Hoekstra, M., Oh, S., & Tangvatcharapong, M. (2023). *Are American juries racially discriminatory? Evidence from over a quarter million felony grand jury cases*. Texas A&M University Department of Economics. https://economics.ucr.edu/wp-content/uploads/2023/10/10-30-23-Hoekstra.pdf
- James, L., James, S. M., & Vila, B. J. (2016). The reverse racism effect: Are cops more hesitant to shoot black than white suspects? *Criminology & Public Policy*, *15*(2), 457-479. https://doi.org/10.1111/1745-9133.12187
- Lange, J. E., Johnson, M. B., & Voas, R. B. (2005). Testing the racial profiling hypothesis for seemingly disparate traffic stops on the New Jersey Turnpike. *Justice Quarterly*, *22*(2), 193-223. https://doi.org/10.1080/07418820500088952
- Last, S. (2020, June 3). American racism and the anti-white left. *Ideas and Data Blog*. https://ideasanddata.wordpress.com/2020/06/03/american-racism-and-the-anti-white-left/
- Michael, J., & Timberlake, J. M. (2007). Are Latinos becoming white? Determinants of Latinos’ racial self-identification in the United States. *Social Forces*, *86*(2), 561-573.
- Robertson, C. T., Baughman, S. B., & Wright, M. (2019). Race and class: A randomized experiment with prosecutors. *Journal of Empirical Legal Studies*, *16*(4), 807-847. https://doi.org/10.1111/jels.12235
- Rosenman, E. T., Olivella, S., & Imai, K. (2023). Race and ethnicity data for first, middle, and surnames. *Scientific Data*, *10*(1), 1-16. https://doi.org/10.1038/s41597-023-02202-2
- Rubenstein, E. S. (2016). *The color of crime: 2016 revised edition*. New Century Foundation. https://www.hoplofobia.info/wp-content/uploads/2021/02/2016-The-Color-of-Crime.pdf
- Schwartz, J. A., & Beaver, K. M. (2019). A longitudinal examination of the association between intelligence and rearrest using a latent trait–state–occasion modeling approach in a sample of previously adjudicated youth. *Developmental Psychology*, *55*(10), 2121-2135. https://doi.org/10.1037/dev0000838
- Serengil, S. I., & Ozpinar, A. (2024). A benchmark of facial recognition pipelines and co-usability performances of modules. *Journal of Information Technologies*, *17*(2), 95-107. https://doi.org/10.17671/gazibtd.1399077
- Shjarback, J. A., & Nix, J. (2019). Considering violence against police by citizen race/ethnicity to contextualize representation in officer-involved shootings. *Journal of Criminal Justice*, *65*, 101653. https://doi.org/10.1016/j.jcrimjus.2019.101653
- U.S. Census Bureau. (2010). *Genealogy data*. https://www.census.gov/topics/population/genealogy/data/2010_surnames.html
Appendix
Mathematical Formulation of Bias for Simulation
For each bias scenario, we systematically reassigned 10% of Greens to Blue classification, with the selection mechanism varying according to the specific bias type being simulated.
Let the Blue centroid be represented by coordinates \((c_x, c_y)\) in our two-dimensional feature space. For each Green point \(g_i\) with coordinates \((x_i, y_i)\), we calculated the Euclidean distance to the Blue centroid:
$$d_i = \sqrt{(x_i - c_x)^2 + (y_i - c_y)^2}$$
The bias assignment probabilities were then defined using exponential functions that create distinct selection patterns for Strategic and Obvious bias types:
$$P_{\text{strategic}}(i) = \exp(-d_i)$$ $$P_{\text{obvious}}(i) = \exp(d_i)$$
These formulations ensure that Strategic bias preferentially selects Green individuals closest to the Blue centroid (higher probability for smaller distances), while Obvious bias preferentially selects those most distant from the Blue centroid (higher probability for larger distances).
We then used weighted sampling on these probabilities (higher values more likely to be sampled) for each respective scenario to produce our end-product simulated datasets:
- Strategic bias: weights proportional to \(P_{\text{strategic}}(i) = \exp(-d_i)\)
- Obvious bias: weights proportional to \(P_{\text{obvious}}(i) = \exp(d_i)\)
- Random bias: uniform weights (weights = 1 for all individuals)
Model Training and Evaluation on Simulations
Following bias introduction, we trained multinomial logistic regression models on each simulated dataset using the simple formula race ~ x + y, where x and y represent the two-dimensional coordinates. This straightforward approach mirrors our linear modeling strategy for the real-world data while maintaining interpretive clarity.
To address class imbalances created by the reassignment process, we implemented inverse frequency weighting:
$$w_j = \frac{N_{\text{total}}}{3 \times N_j}$$
where \(w_j\) represents the weight for class \(j\), \(N_{\text{total}}\) is the total sample size, and \(N_j\) is the number of observations in class \(j\) after bias introduction. This weighting scheme ensures that our models optimize for balanced performance across all three groups. This was done to correct for the imbalance produced by reassignment, and for consistency with the method used on the real dataset.
The simulation process generates four distinct datasets: the original unbiased dataset plus three variants incorporating Random, Strategic, and Obvious bias patterns, respectively. These four scenarios are visualized, illustrating how each bias type creates characteristic distortions in the group assignment patterns.