Table of Contents
TL;DR
-
Global IQ is declining at 1.1 points per decade, with 35.5% of this decline attributable to dysgenics (fertility differences between individuals)
-
The high-IQ working age population peaked between 1990-2040 and is now in decline; those with IQ ≥ 131 will decrease by 73.4% by 2100 (relative to 2025)
-
By 2100, nearly 40% of the world’s working-age population will have IQ <70, up from levels comparable to the 115-130 IQ bracket in the 1950s
-
The +2SD IQ threshold (top 2.3% of population) will drop from 128 to 116 by 2100
-
Global innovation capacity will halve by 2100, resulting in a loss of approximately 18 years of innovation potential this century
Introduction
Talented, industrious, and intelligent individuals are vital to humanity’s progress. Their high productivity drives economic growth while their ingenuity advances science and innovation, uplifting everyone.
This relationship extends beyond individuals to nations as well. A country’s National IQ (NIQ) serves as a powerful predictor of its scientific output, economic performance, and overall standard of living.
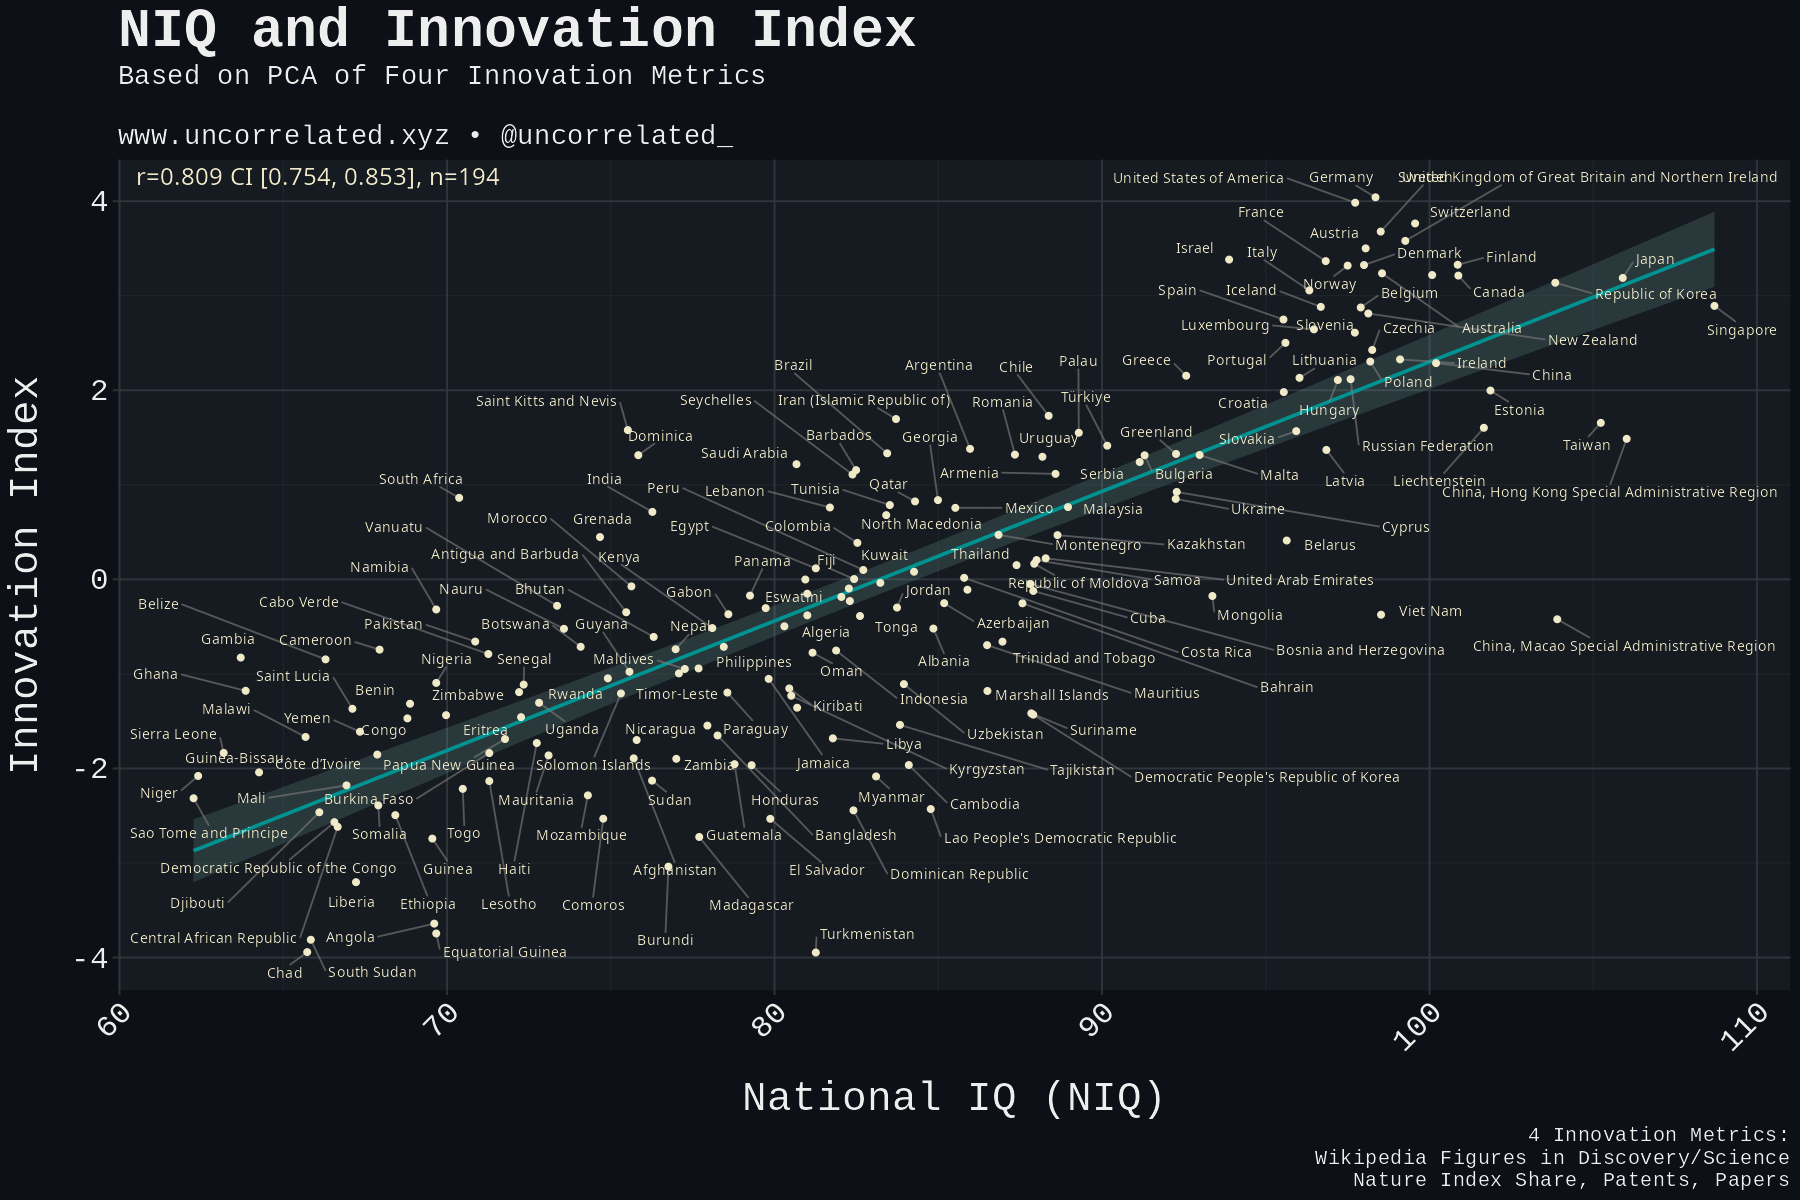
We can observe this connection in the relationship between the Innovation Index—a composite measure combining living Wikipedia figures in Discovery/Science, Nature Index publications, patents, and academic papers—and NIQ.
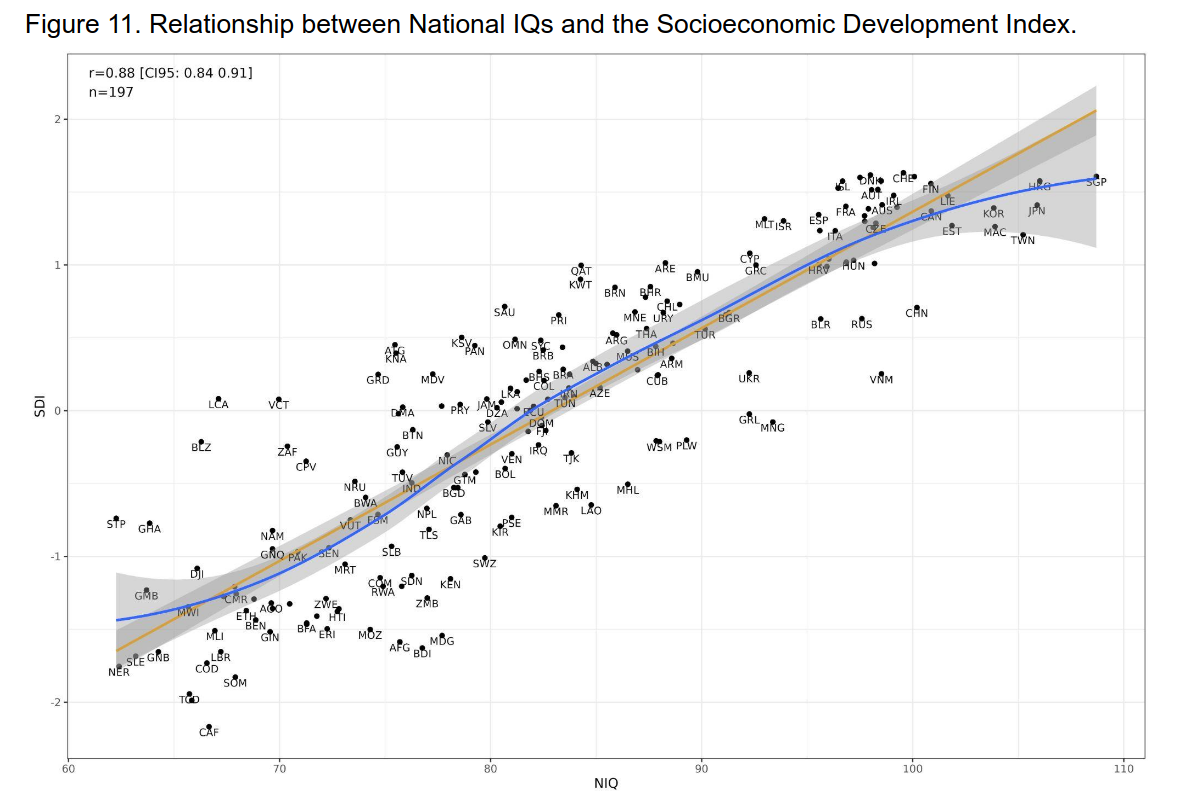
This pattern is further reinforced by the strong correlation between NIQ and the Socioeconomic Development Index, which integrates multiple indicators including mortality rates, infrastructure development, pollution levels, safety metrics, economic performance, educational attainment, and technological advancement.
If talented, intelligent individuals and nations are indeed crucial for development and innovation, then the declining numbers of such people should be cause for concern.
And declining they are.
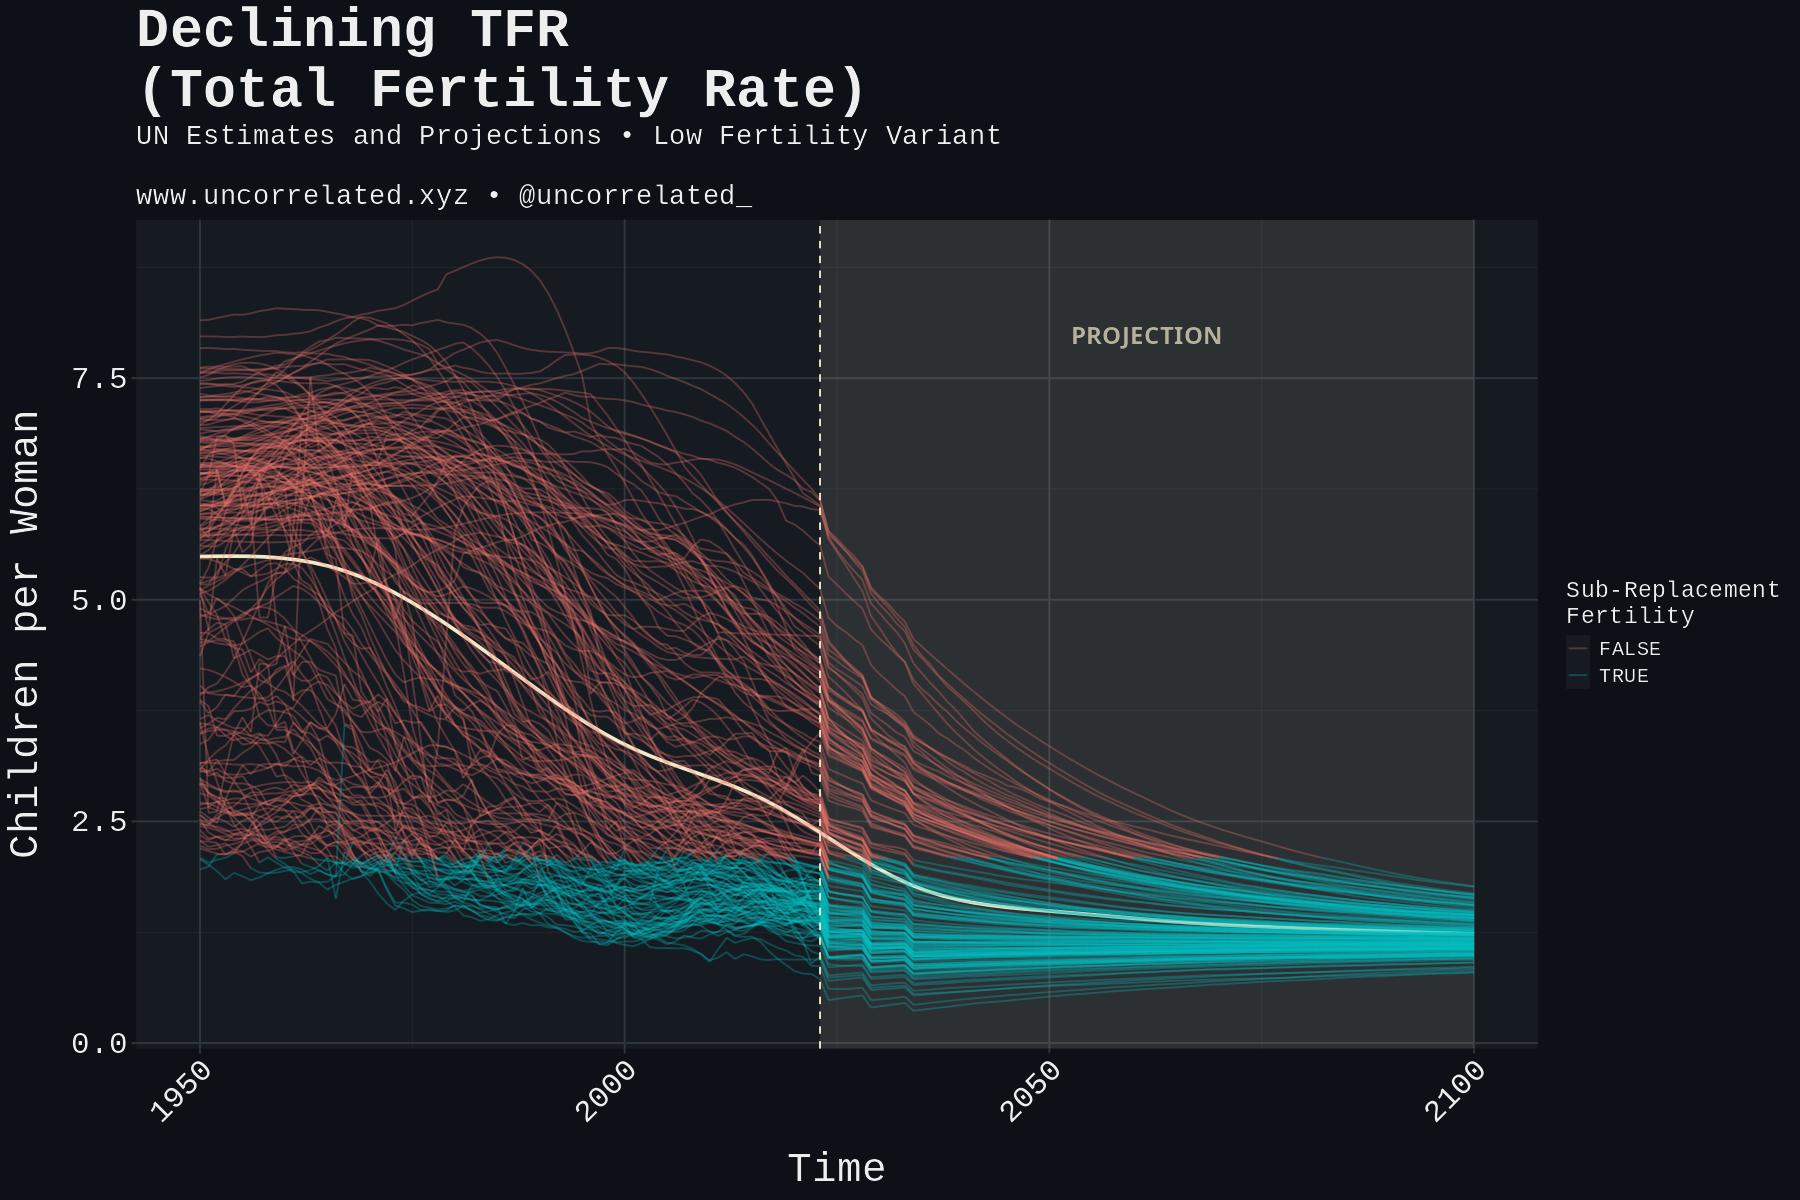
Female fertility rates have been falling worldwide, with most countries now below replacement level—the threshold at which women have too few children to maintain population stability.
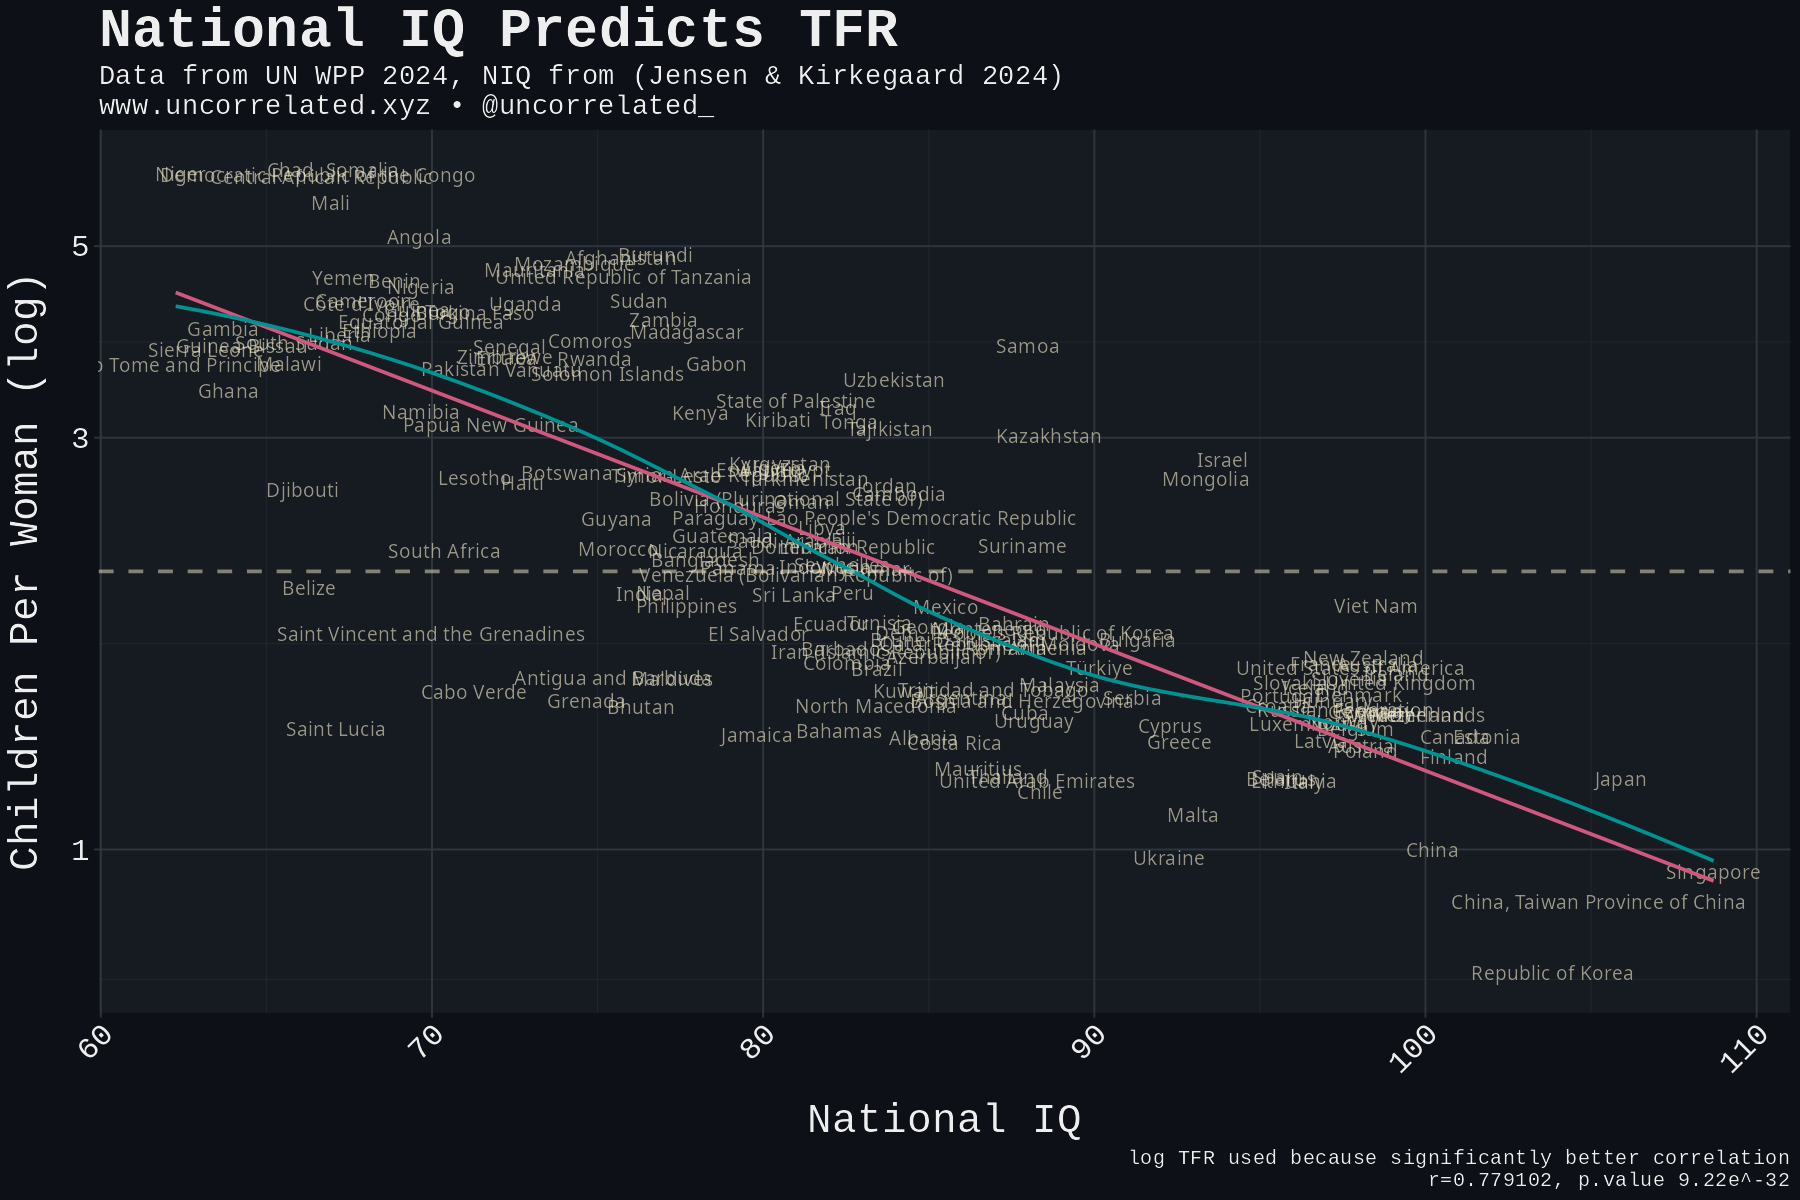
The issue isn’t merely that overall fertility is declining, leading to shrinking populations. More troublingly, NIQ strongly negatively predicts fertility rates. Simply put: smarter countries have fewer babies. Consequently, the most developed nations with the highest concentrations of talent have experienced sub-replacement fertility for decades, with rates continuing to fall further.
The situation worsens when we consider individual-level data. Globally, individuals with higher education and income consistently produce fewer offspring than their peers, while those with lower cognitive ability tend to have more children.
Recent genomic studies from both the United States and United Kingdom confirm this pattern, showing that genetic variants associated with education and income are diminishing in frequency across generations.
These trends will likely have profound consequences for human economic development and wellbeing, amplifying the already concerning effects of declining fertility rates worldwide.
Innovation as Uncertainty
As concerning as these trends may be, they could potentially become irrelevant for an unexpected reason: artificial intelligence.
If we develop truly advanced AGI systems in the near future—systems capable of accelerating scientific discovery, transforming economic productivity, solving major health challenges including aging, or even posing existential risks—our future will become radically unpredictable.
Such a transformation would likely render concerns about gradual genetic selection against intelligence or declining fertility across generations largely moot. Our world would instead be continuously reshaped by exponentially compounding innovation generated by networks of intelligent machines operating globally.
This wouldn’t be the first time technological breakthroughs have helped humanity avoid predicted disasters. Peak oil concerns dominated discussions in the late 2000s, but innovations in extraction technology and new reserve discoveries effectively navigated around the problem. Similarly with climate change, the rapidly falling costs of renewable energy and batteries are now driving down emissions in ways that seemed unlikely just a decade ago.
However, the singularity remains theoretical, and unlike peak oil or climate change, dysgenics and population decline directly affect the very engine of solutions: innovation itself. This creates a potentially dangerous feedback loop that, if not disrupted by transformative AI within the next few decades, could lead to a new dark age for humanity.
To understand this dynamic better, we should conceptualize innovation as fundamentally representing uncertainty about the future.
Forty years ago, no one could have accurately predicted how the internet and smartphones would transform virtually every aspect of modern life—from work and education to commerce, banking, socializing, and dating. It is sometimes said that genius hits the target that nobody sees. Likewise, if the world today is the accumulation of the efforts of genius, the world is a series of changes nobody foresaw.
This principle works bidirectionally: just because transformative AI appears imminent doesn’t guarantee it will materialize as expected, or at all. Dysgenics and declining fertility could continue to exert meaningful influence regardless.
Therefore, if innovation represents uncertainty, and if dysgenics and low fertility reduce innovative capacity, we face a self-reinforcing cycle: declining fertility and dysgenics reduce innovation, which in turn reduces uncertainty about our future trajectory. Greater certainty about continued population decline and dysgenics then further entrenches these trends.
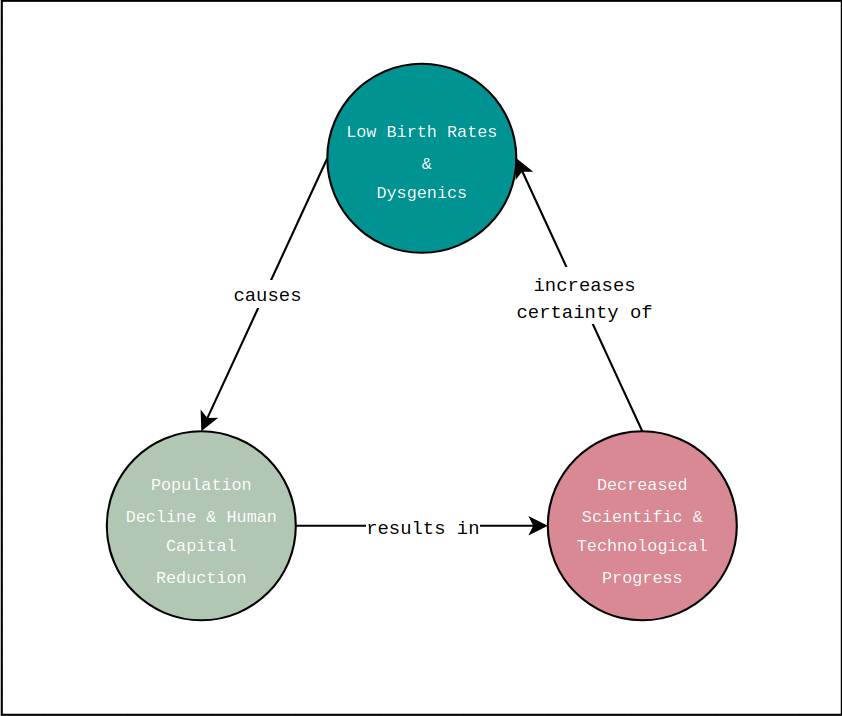
This feedback mechanism is what makes declining birth rates and dysgenics truly concerning. Once innovation falls to half its previous level, the probability of developing transformative technologies capable of breaking this cycle diminishes accordingly.
If this loop remains unbroken, humanity could eventually enter a prolonged period of stagnation. With this sobering introduction, let’s examine the data to estimate how much time remains before this cycle becomes difficult to escape.
To answer this question, we must explore the literature on dysgenics and fertility, integrating the most reliable quantitative data into a comprehensive forecast.
We’ll then develop an accurate measure of innovation, use NIQ to predict it, and model the effects of demographic changes through linear analysis.
Our forecasting approach focuses primarily on global IQ trends both within and between countries. While intelligence is just one dimension of human capital, its effects are well-studied and readily interpretable, making it an ideal focus for our projections.
The Numbers: Dysgenics
As alluded to, dysgenics extends beyond IQ. Within human biodiversity research, the phenomenon is often conceptualized and measured in terms of intelligence, largely because IQ provides a convenient and interpretable metric. However, the dysgenic effect encompasses a broader range of heritable traits related to human capital.
Dysgenics in Genomics
The genomics literature offers compelling evidence for this broader dysgenic pattern.
A recent US study, Natural Selection Across Three Generations of Americans (Hugh-Jones & Edwards, 2024), analyzed data from the “Health and Retirement Study,” which includes several thousand genotyped Americans born between 1920-1960. The researchers calculated each participant’s relative lifetime reproductive success (RLRS) and used polygenic scores—genetic predictors of various traits—to identify which genetic profiles were associated with higher reproductive rates.
Their analysis spanned three generations by examining not only the participants’ own reproductive outcomes but also their number of siblings (previous generation) and grandchildren (next generation).
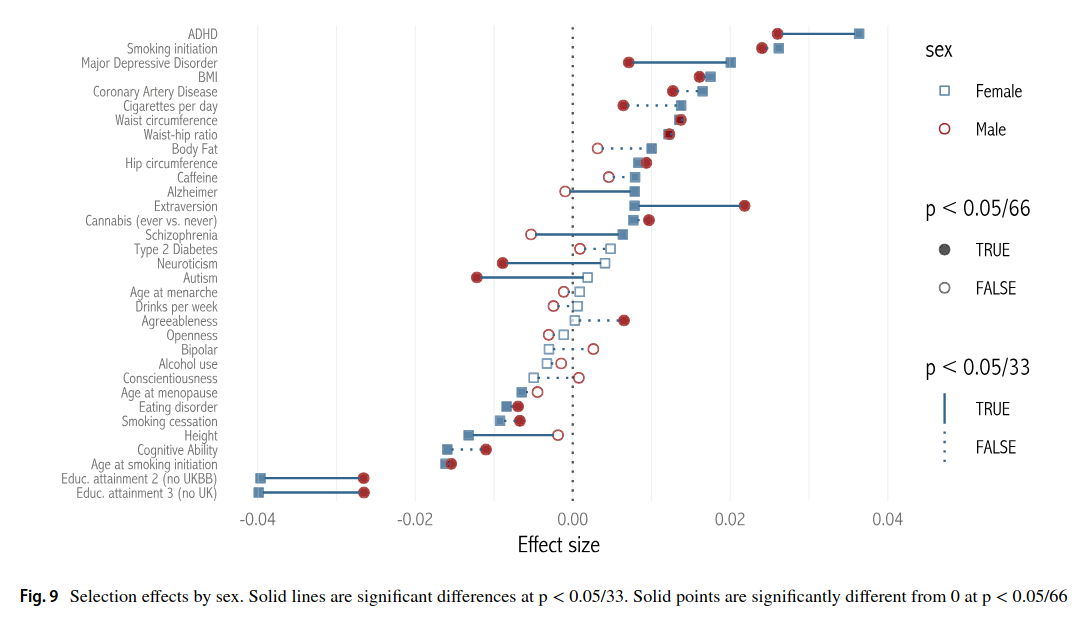
The results revealed a consistent pattern, with the x-axis below showing effect sizes on reproductive success:
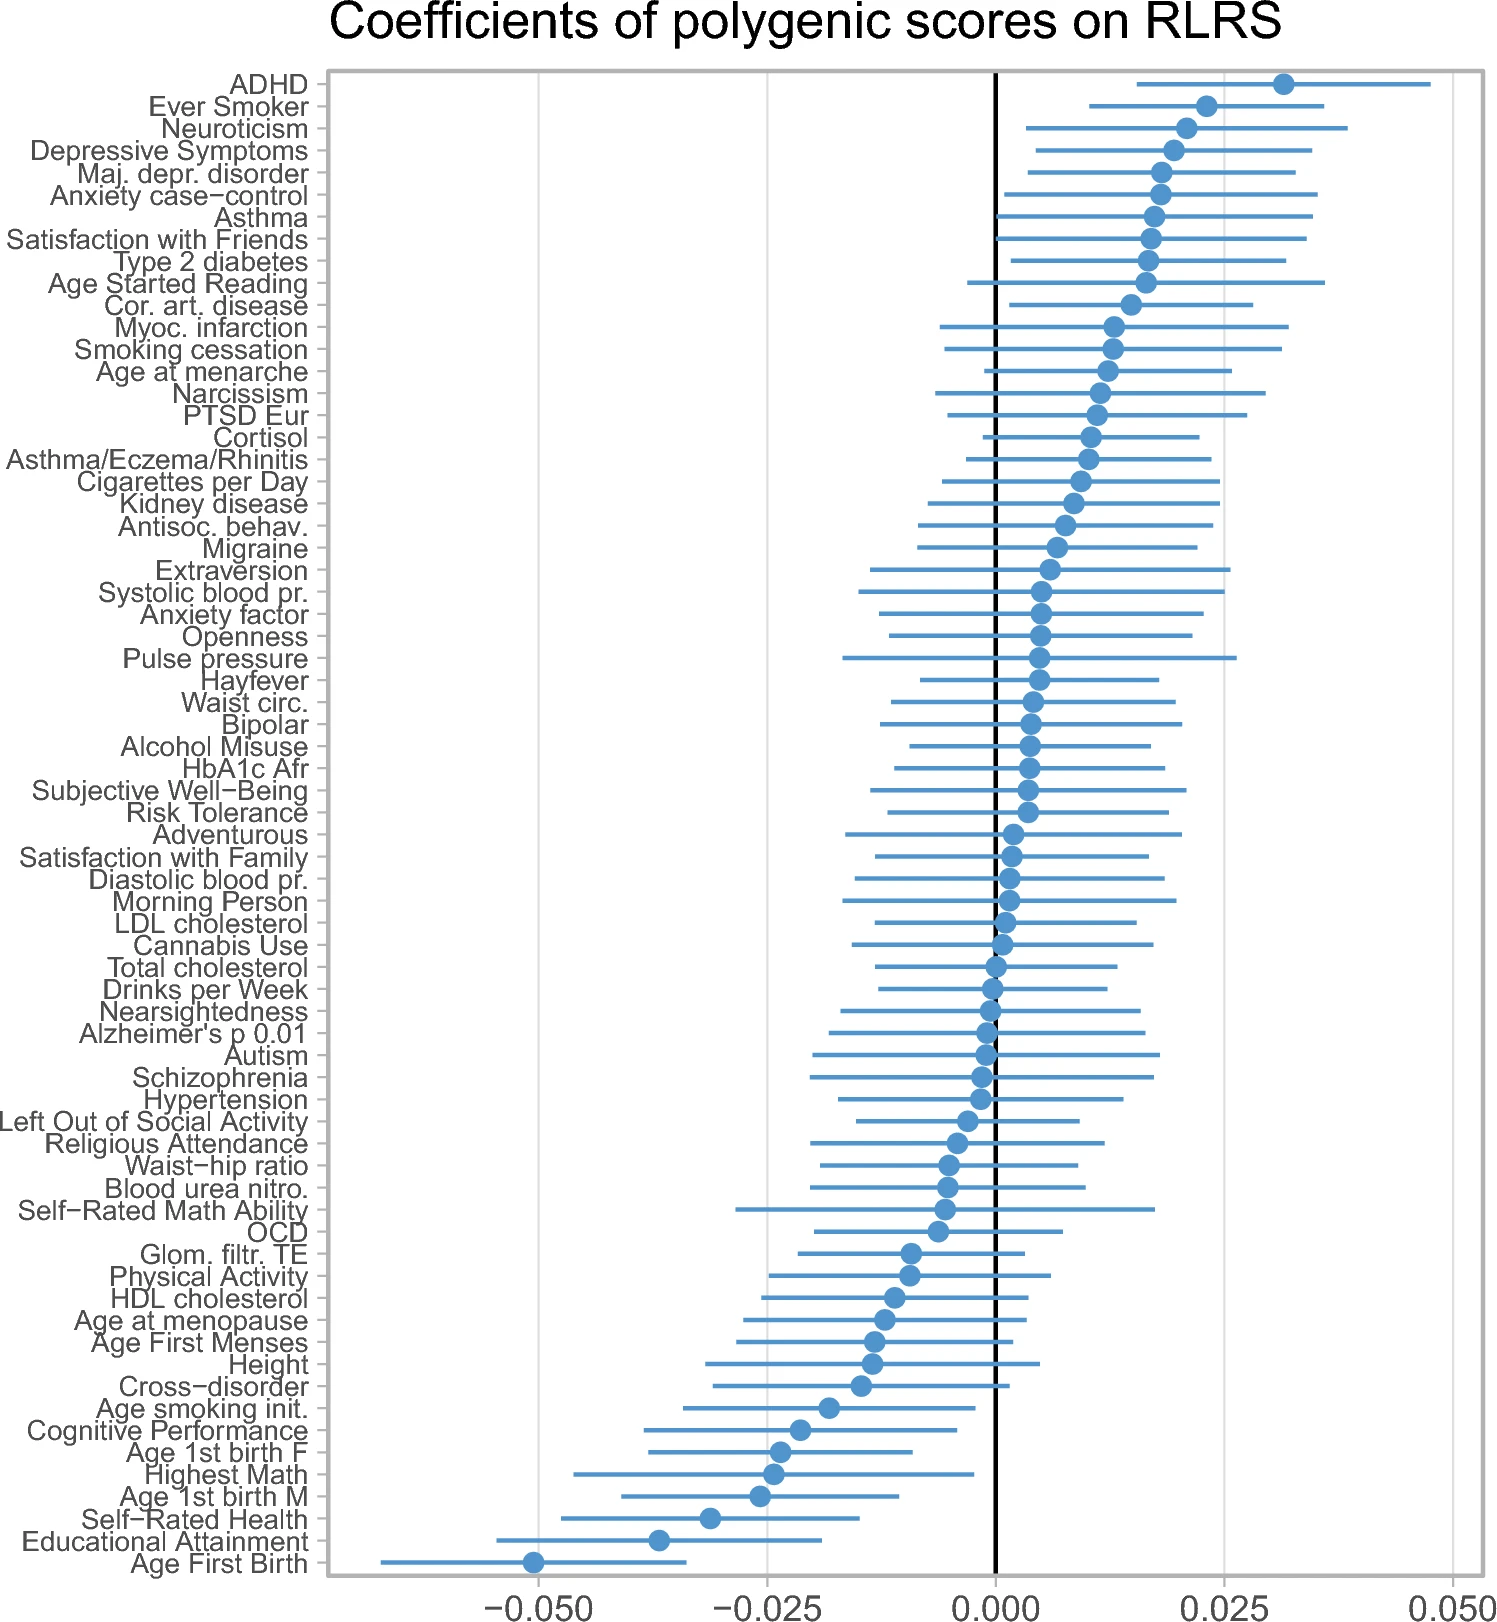
The data demonstrates that genetic variants associated with depression, lower educational attainment, poorer health, and lower cognitive ability predict greater reproductive success. Notably, ADHD shows the strongest positive selection, while educational attainment is the second most strongly selected against.
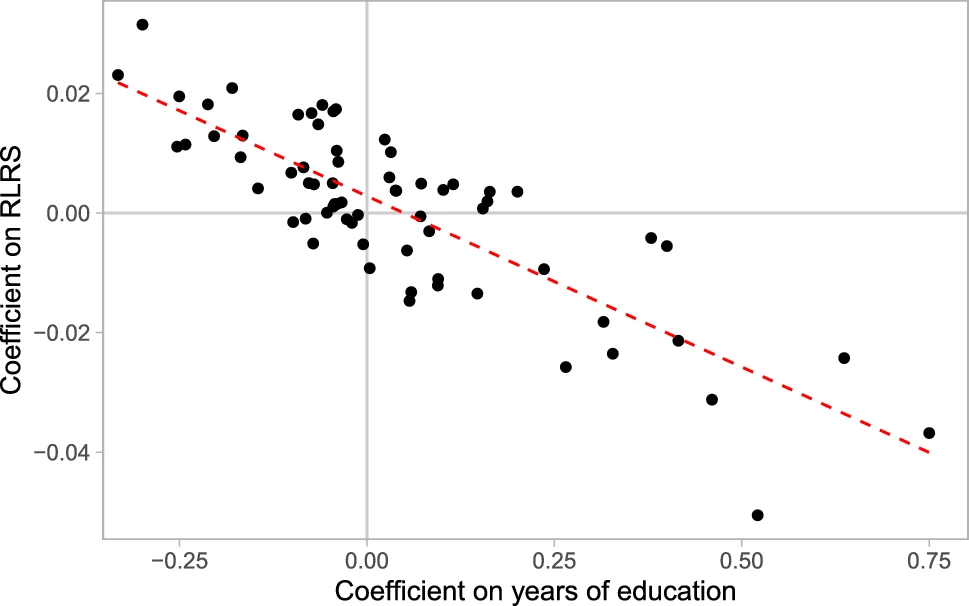
Given the known negative relationship between ADHD and educational achievement, the researchers investigated whether a trait’s relationship to education might predict its selection pattern. Indeed, they found an extraordinarily strong negative correlation (r=-0.829) between a trait’s association with education and its relationship to reproductive success:
This study built upon earlier research. Human Capital Mediates Natural Selection in Contemporary Humans (Hugh-Jones & Abdellaoui, 2022) conducted similar analyses using the UK Biobank dataset and likewise found that genetic variants associated with education and earnings were being selected against:
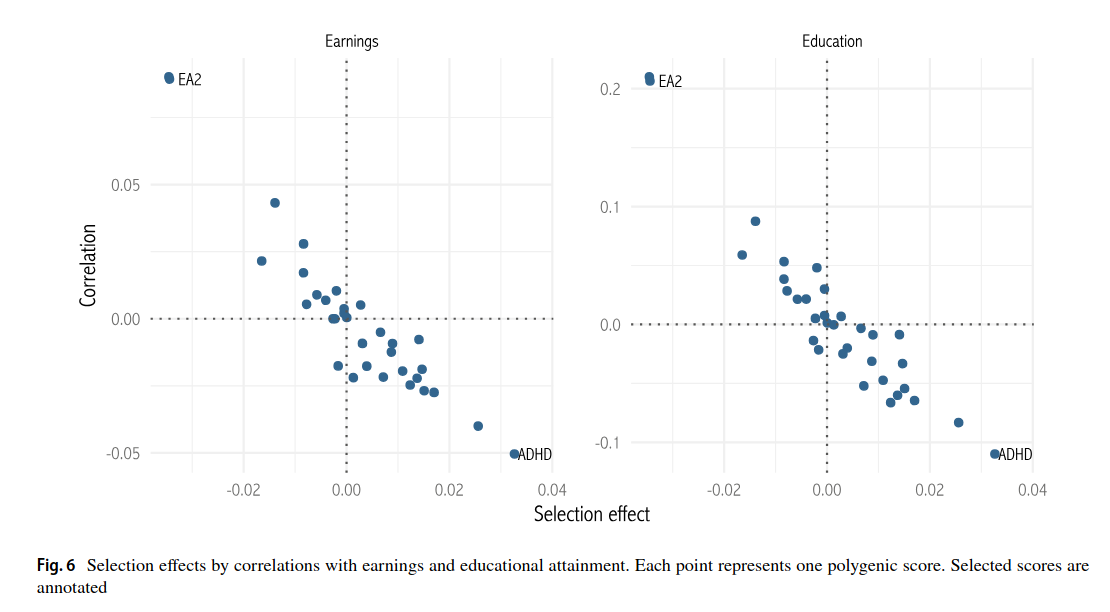
This second paper also mapped selection patterns across a wide range of traits, from those most negatively selected against to those most positively selected for. The consistency across traits is striking:
These findings demonstrate a robust pattern across both US and UK populations: genetic variants associated with depressive disorders are being selected for, while those linked to better health, higher cognitive ability, and greater educational attainment are being selected against.
Quantifying IQ Decline
How can we translate these selection effects into concrete estimates of IQ change over time? What do these “effect sizes” mean in practical terms?
A significant challenge in this analysis is the limited predictive power of current polygenic scores. These scores remain noisy predictors of actual phenotypic traits—not because genetics or heritability poorly predict traits, but because our genetic models are still developing.
This gap between known genetic influences and observed heritability from twin studies is known as “missing heritability.” While this limitation will likely be resolved as genomic science advances, it currently requires adjustment in our calculations.
We can theoretically correct for this error by multiplying effect sizes by the square root of the ratio between trait heritability (h²) and polygenic score accuracy (r²). The first paper we discussed attempts this adjustment, yielding more reasonable effect estimates:
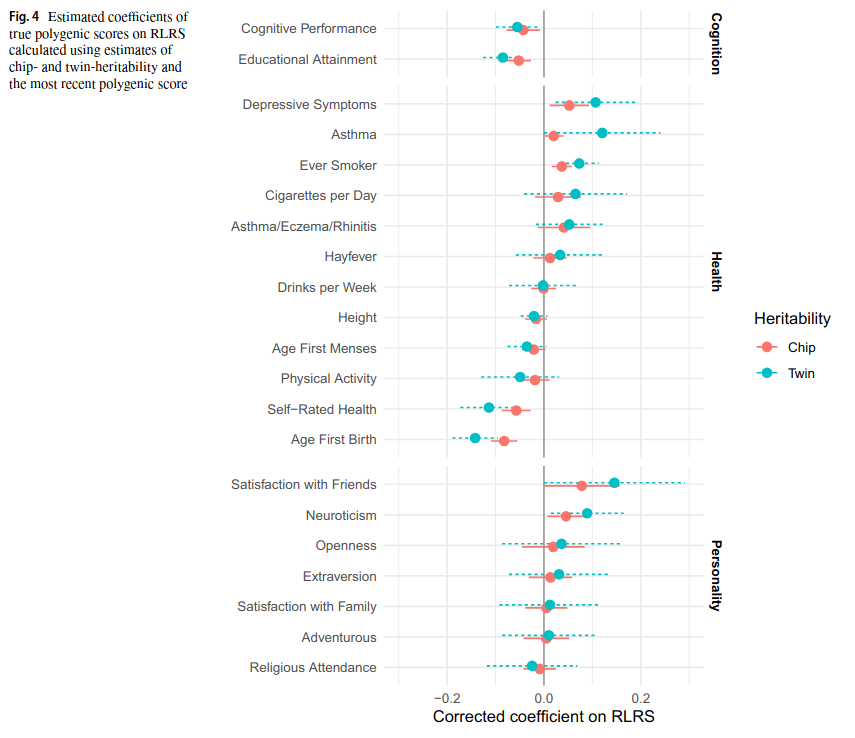
With these adjusted values, we can estimate the rate of IQ decline. The coefficient for “Cognitive Performance” on RLRS is approximately -0.06 using twin heritability. Let’s convert this into a more interpretable IQ points per decade:
- Start with the genetic selection coefficient: -0.06 standard deviations per generation
- Convert to phenotypic change by multiplying by IQ heritability (h²):
- Using h² = 0.8 (80% heritability)
- -0.06 × 0.8 = -0.048 standard deviations
- Convert from standard deviations to IQ points:
- IQ has a standard deviation of 15 points
- -0.048 × 15 = -0.72 IQ points per generation
- Convert from per generation to per decade:
- Mean age of conception (MAC) in USA ≈ 31 years (UN data, 2023)
- Per decade rate = (10 years ÷ MAC) × per generation rate
- (10 ÷ 31) × -0.72 = -0.23 IQ points per decade
This calculation yields an estimated decline of -0.23 IQ points per decade for the USA.
How does this genomics-derived estimate compare with direct measurements?
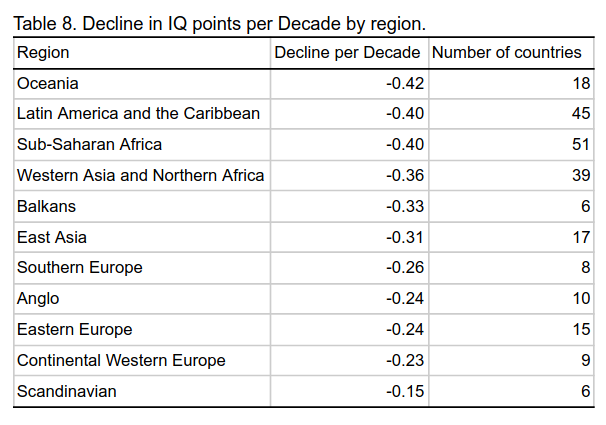
The International meta-analysis of differential fertility for intelligence (Jensen et al., 2023), which directly measures IQ dysgenics rather than using genomic methods, found IQ declines of 0.1 to 0.38 points per decade across the Anglosphere, with -0.38 for the USA specifically:
Our genomics-based calculation (-0.23) falls remarkably close to these directly measured estimates!
While these calculations should be considered approximations rather than precise predictions, their alignment with measured values suggests they capture the general magnitude of the effect. They provide a reasonable guide to what traits are being selected for or against, and at what relative rates.
Selection Against IQ and SES
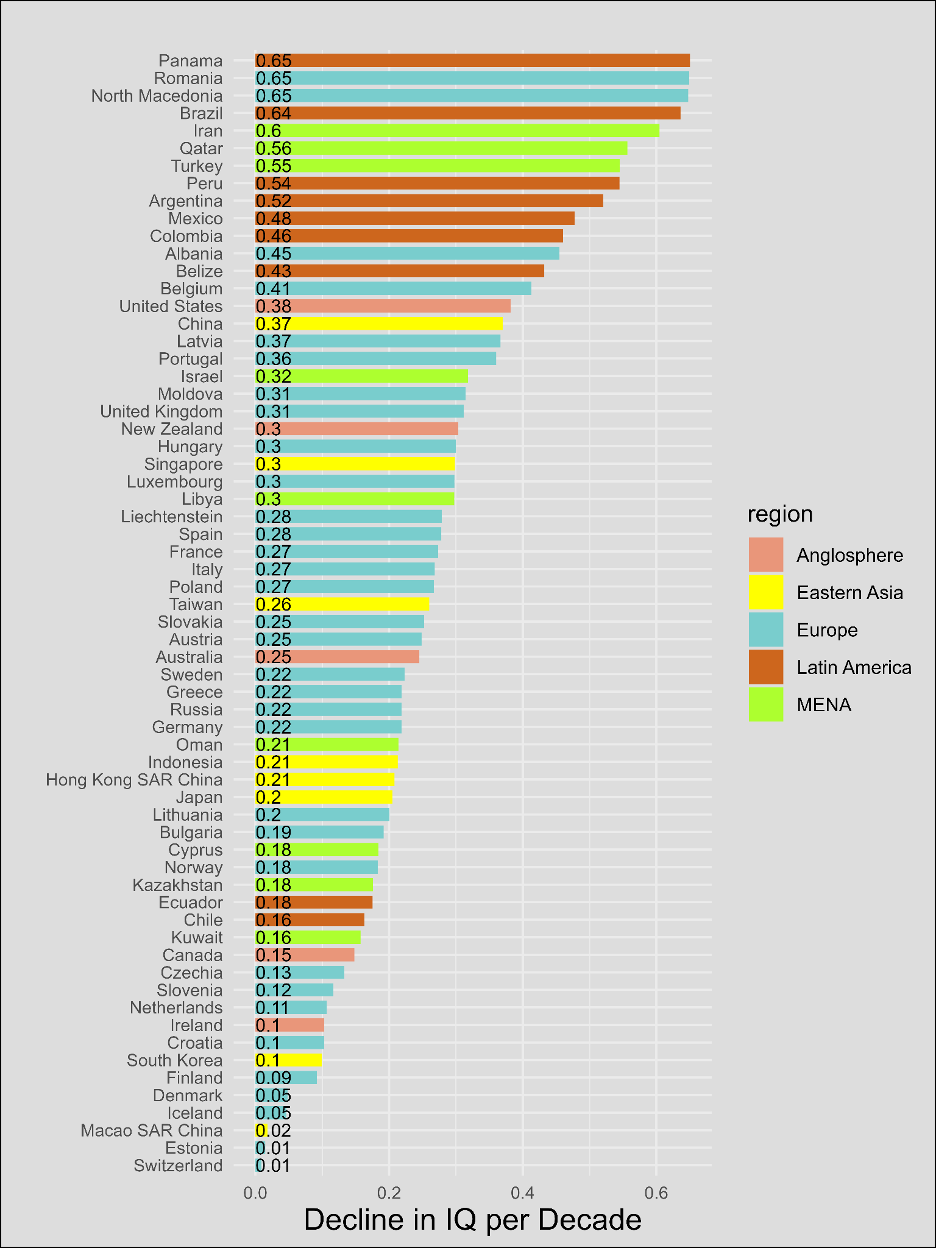
Moving from genotypic to phenotypic selection, we find that dysgenic effects vary significantly by region and socioeconomic context. Selection against intelligence appears stronger in less developed countries:
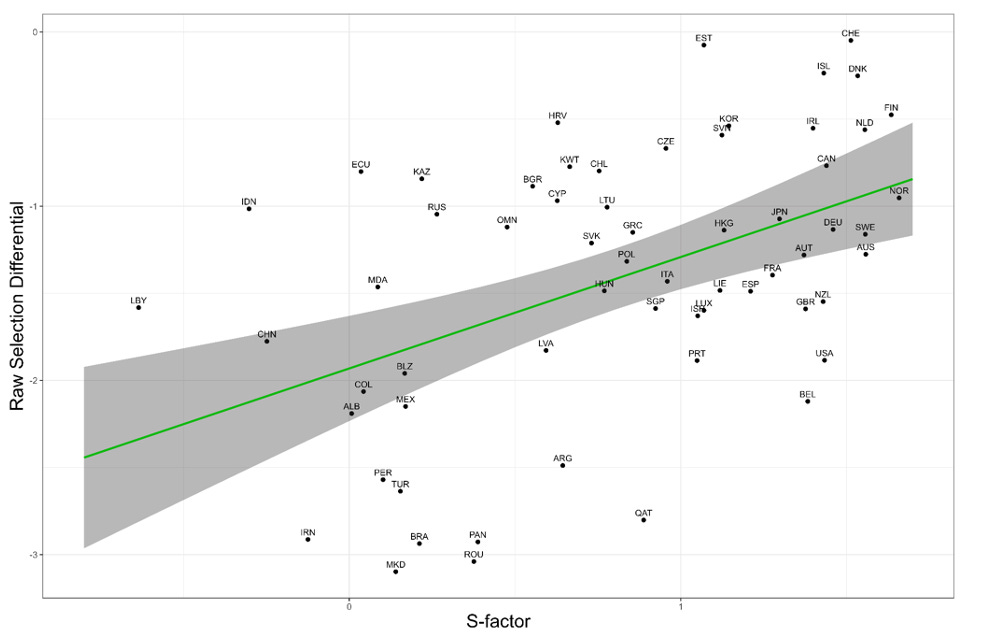
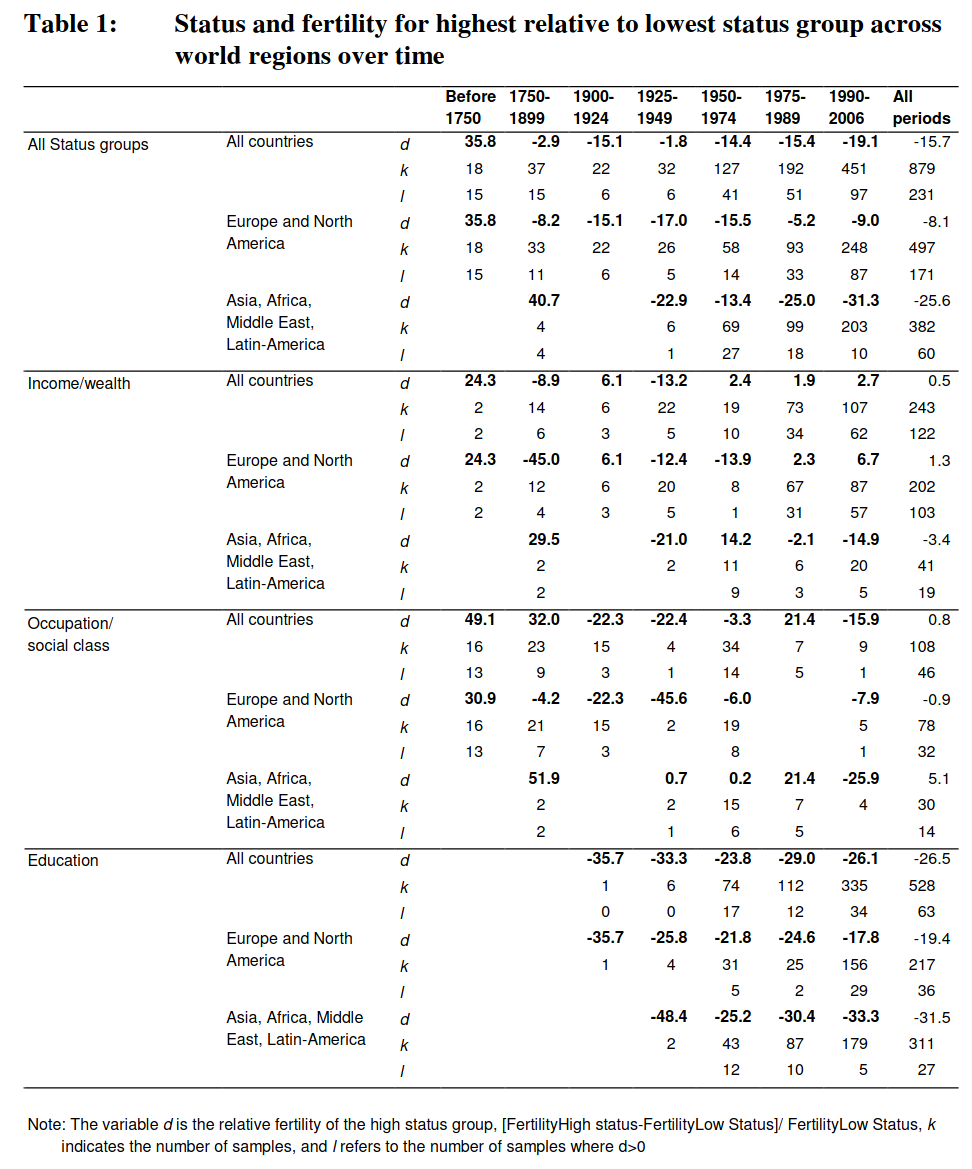
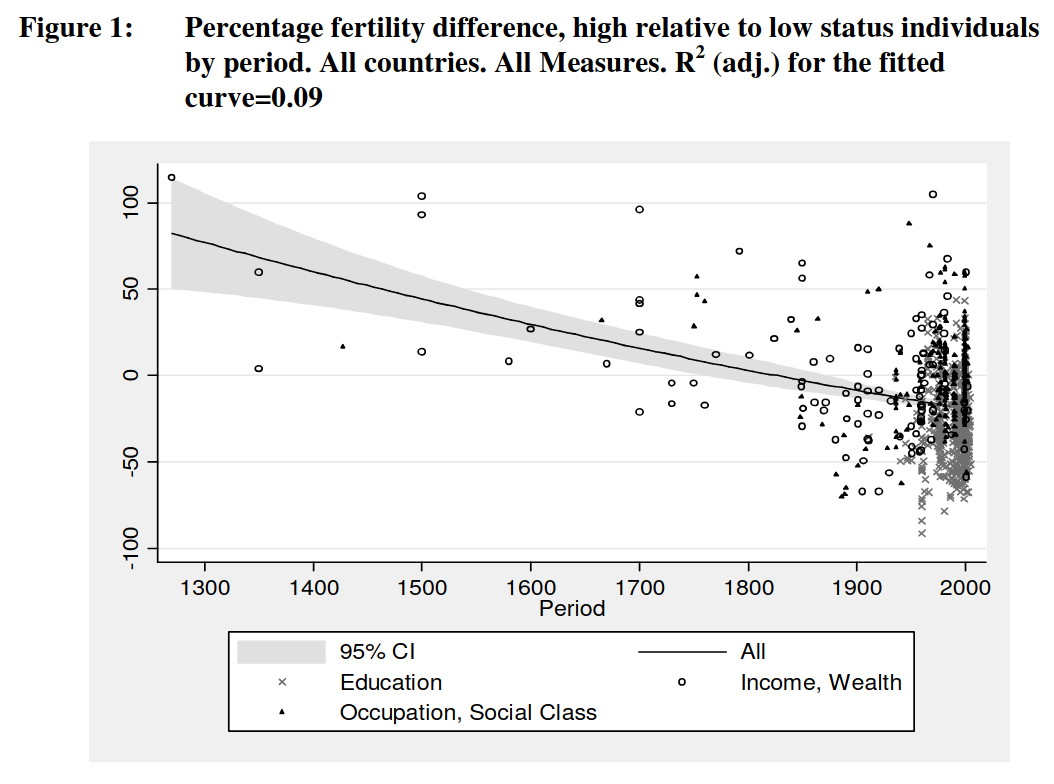
This pattern is mirrored in research on socioeconomic status (SES). The paper Fertility trends by social status (Skirbekk, 2008) systematically analyzed measurements of SES—including education, occupational status, and income/wealth—and compared reproductive outcomes between high and low status individuals across different time periods and regions.
The findings revealed not only that selection for SES has turned negative in recent decades, but also that this negative selection is more pronounced in developing regions:
This regional pattern is further reinforced by individual-level data from the genomic studies discussed earlier. Dysgenic effects were stronger among younger mothers and those with lower income and education:
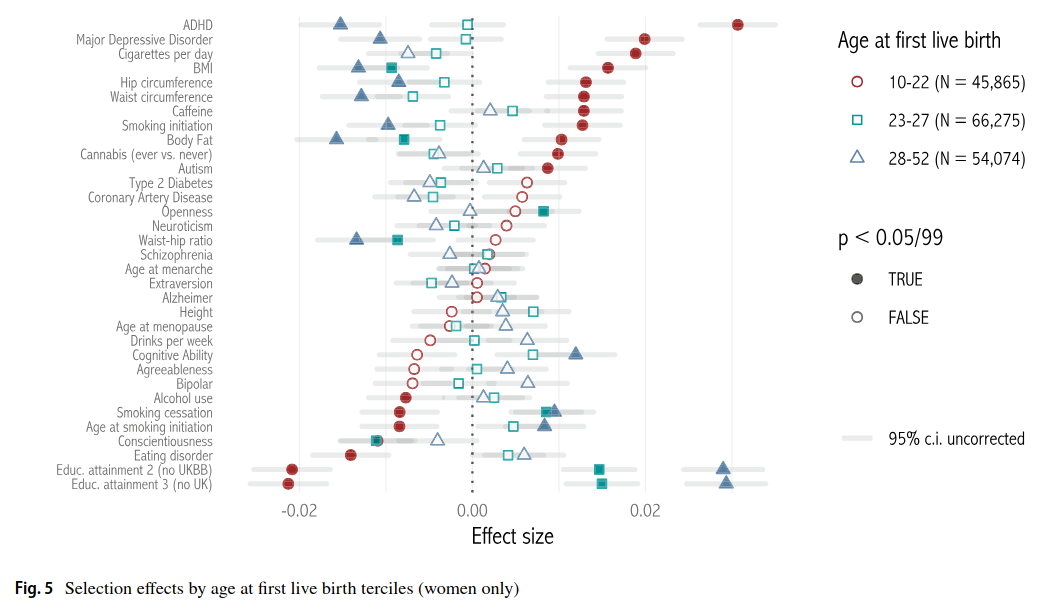
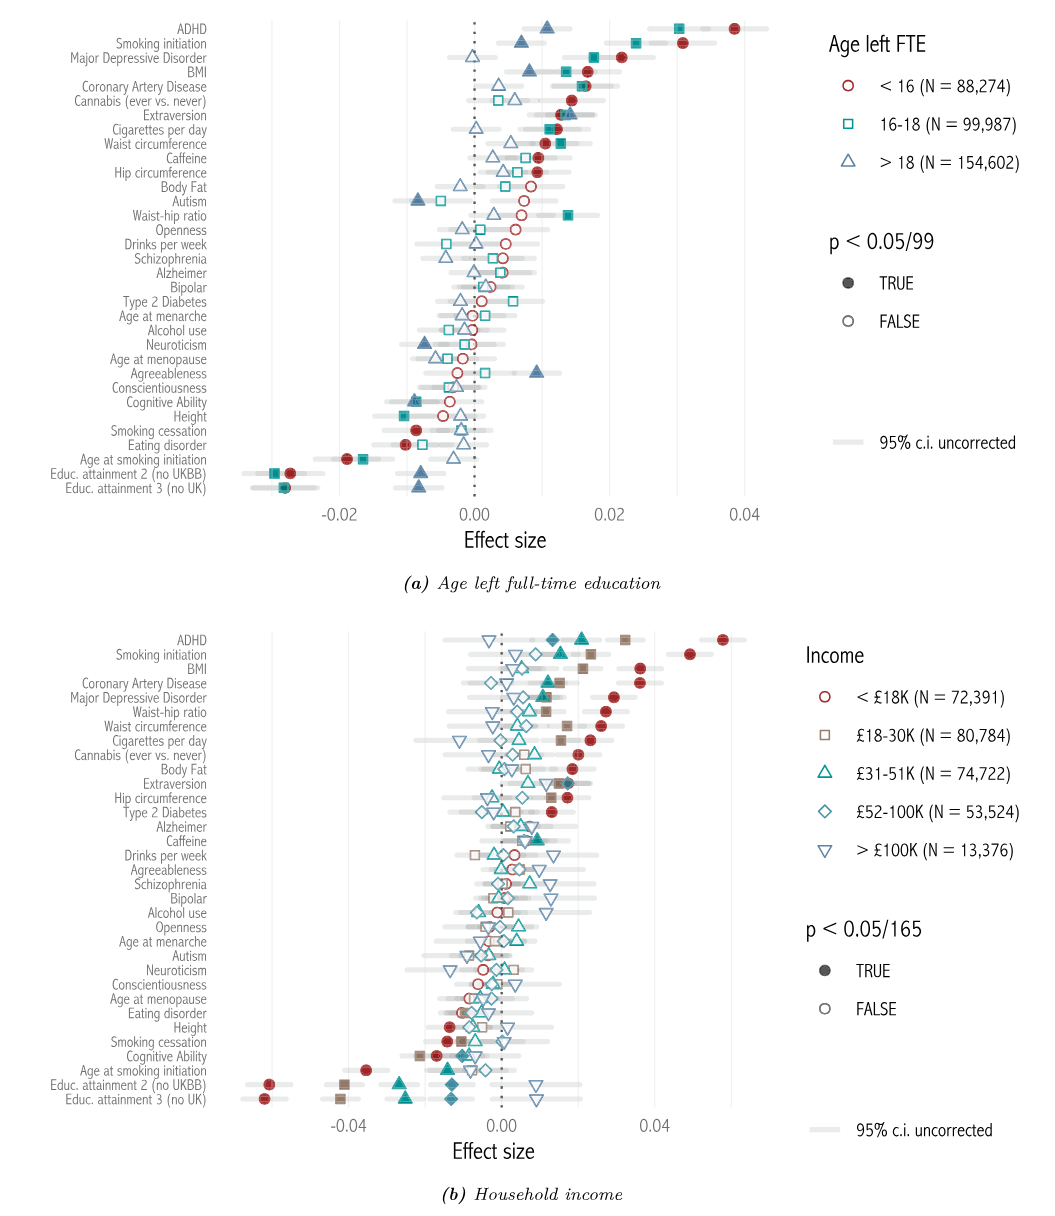
This creates a striking parallel: the same factors—lower income and education—predict stronger dysgenic effects at both individual and national levels. While this could be coincidental, the consistency of the pattern across different scales and methodologies suggests a robust relationship.
To summarize, substantial evidence indicates selection against traits associated with human capital (education, SES, IQ) within populations. This selection appears particularly strong in lower-income countries and among lower-income individuals. While the magnitude of this dysgenic effect remains modest—typically fractions of an IQ point per decade—its cumulative impact over multiple generations could become significant.
The Numbers: Fertility, Population Projections, Aging Populations and Migration
While selection effects tell us about relative changes in trait distributions, absolute population changes are equally crucial for understanding the future of human capital. Selection is inherently relative—it describes how traits shift on average regardless of total population size. For our model to be comprehensive, we need to consider not just average IQ by country, but the actual number of individuals at each IQ level.
This distinction matters because selection processes as described earlier are relatively slow. In developed countries, it would take centuries for selection alone to shift average IQ by a full standard deviation.
If global fertility remained above replacement level, the absolute number of high-IQ individuals might still increase despite dysgenic trends, potentially offsetting concerns about declining innovation. However, as we’ve established, fertility rates have fallen below replacement level in most developed countries—precisely those with the highest average IQ.
The Inaccuracy of UN Forecasting
To project these population dynamics accurately, we need reliable population forecasts. The United Nations publishes updated projections every two years, but their accuracy has been questionable. For a more detailed analysis of UN forecasting methods and alternative approaches, see my previous analysis.
The limitations of UN projections are evident in historical comparisons, as shown below:
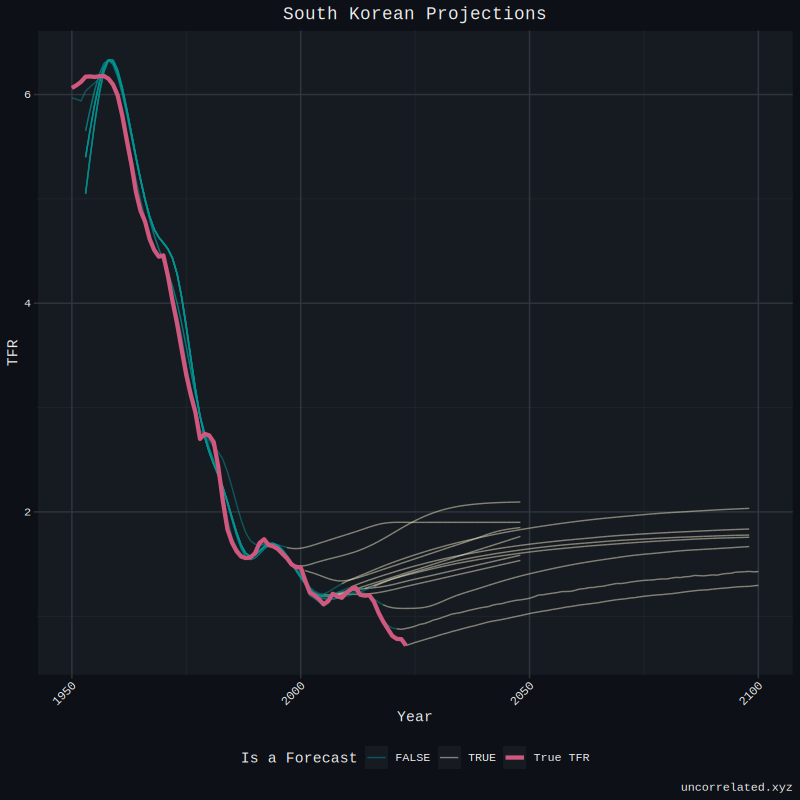
The UN has consistently underestimated the pace of fertility decline, particularly in rapidly developing regions. This pattern is clearly illustrated in recent data from the Financial Times, showing how fertility rates in South American countries have fallen far below UN projections:
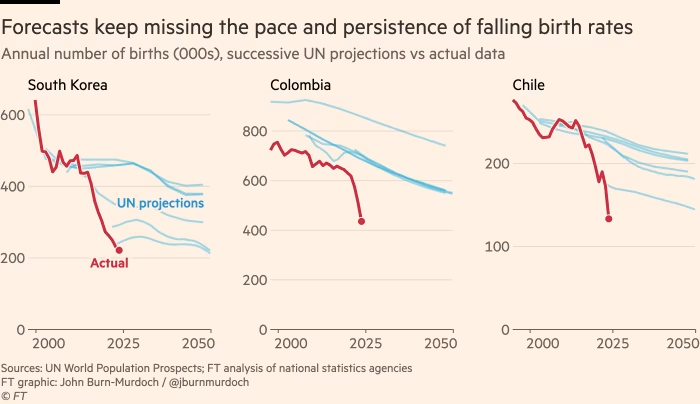
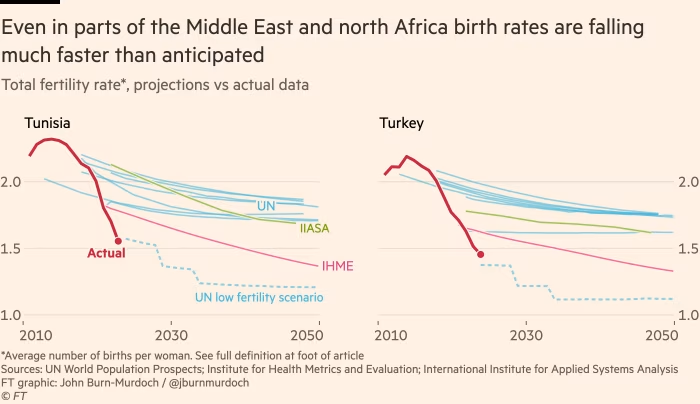
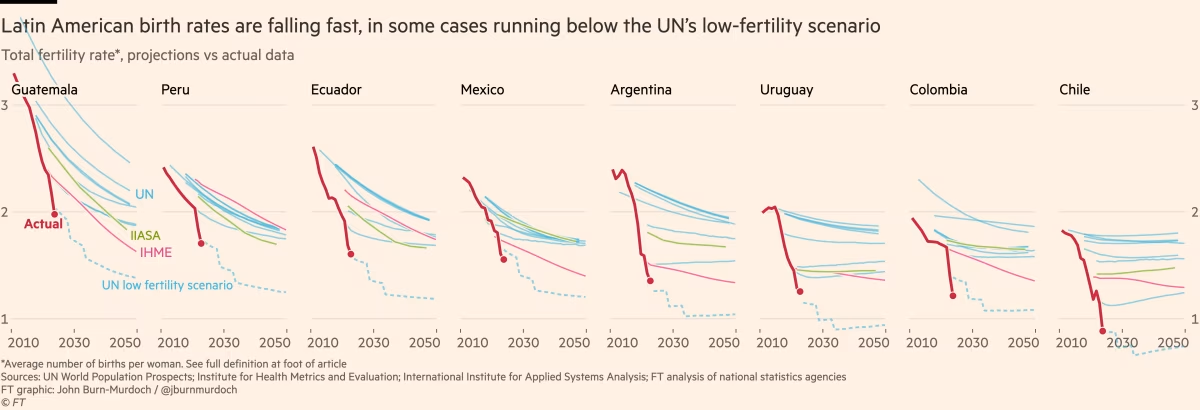
Given this systematic bias, we can reasonably conclude that standard UN population projections are likely too optimistic. To compensate for this, our analysis uses the UN’s “Low” fertility variant, which has historically tracked closer to actual outcomes.
Aging Population Dynamics
Population size alone doesn’t tell the full story—age distribution is equally important, especially when considering innovation potential and economic output. Children contribute minimally to current innovation, while elderly individuals have typically produced their most significant contributions earlier in life.
The UN’s methodology for projecting life expectancy introduces additional concerns. Their models assume linear increases in longevity, even for countries already approaching or exceeding 90 years of life expectancy:
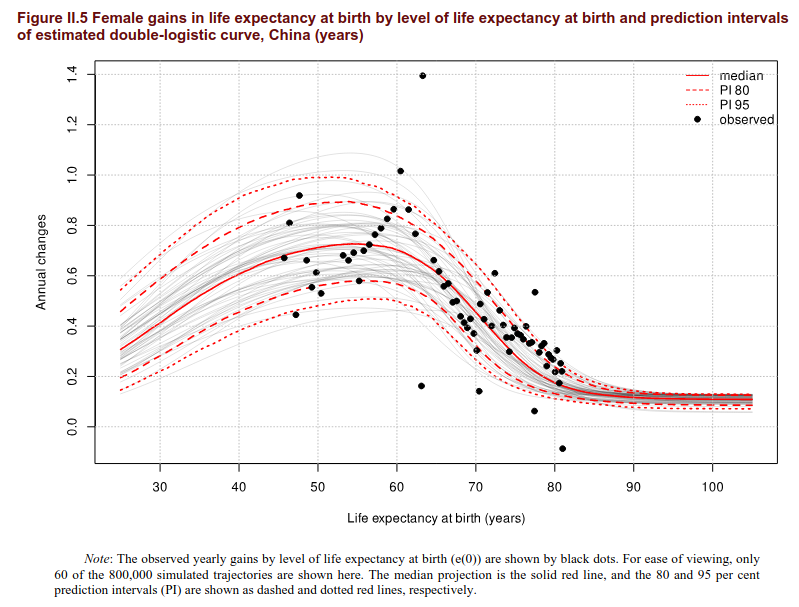
This assumption distorts projections for countries with the combination of very low fertility and high life expectancy—a common pattern given the two are correlated. Such projections can create unrealistic scenarios where countries maintain large elderly populations despite minimal reproduction.
As emphasized in our introduction, our goal extends beyond simply documenting dysgenic trends—we aim to understand how these patterns, combined with demographic shifts, will affect the global pool of human capital and its capacity for innovation.
Migration Effects
Migration adds another layer of complexity to population projections. While migration doesn’t alter an individual’s genetic potential, it can significantly affect where and how that potential is realized.
Our model makes a simplifying assumption that focuses on genetic factors. This is admittedly an oversimplification—development clearly influences innovative output, as demonstrated by China’s dramatic rise in scientific productivity. Talented individuals from developing countries likely realize more of their potential after moving to environments with better research infrastructure, education systems, and funding opportunities.
However, research also indicates that migrants and their descendants often retain characteristics associated with their ancestral populations. In many cases, especially in Europe, migrants are a net fiscal negative.
Since this analysis focuses primarily on global trends rather than migration specifically, we’ll acknowledge these complexities without exploring them in depth.
Method
Our approach integrates multiple data sources to create a comprehensive model of global IQ distribution and innovation potential over time. The high-level overview of our methodology is as follows:
-
For each country, we compile:
- National IQ estimates
- Dysgenics estimates on NIQ per year
- Population projections by age, adjusting for migration and low fertility
- Innovation Index values
-
Using this data, we calculate for each country and year:
- National IQ by year (dysgenics-adjusted)
- Innovation Index, adjusted for the effect of dysgenics
- Working age population
-
Finally, we use population-weighted averages to determine for each year:
- The combined effect of dysgenics and declining population on innovation
- Average global IQ
- Additional demographic statistics
The following sections explain each component in detail, including data sources and calculation methods.
Dysgenics and NIQ
We obtained National Dysgenics rates from Jensen et al. (2023) and National IQ values from National IQs and Socioeconomic Development (Jensen & Kirkegaard, 2024).
For many countries, direct dysgenics measurements were unavailable. We addressed this gap by imputing missing values based on NIQ, which provides reasonable accuracy (r = 0.539, p<0.001).
To convert generational IQ decline rates to annual rates, we used the UN’s data on mean age of conception by country. This conversion is necessary because dysgenics literature typically reports effects per generation, while our model operates on a yearly timescale.
Population Projections
Creating accurate population projections required addressing several limitations in standard UN data. The UN’s modal “Medium” scenario consistently overestimates future populations, as demonstrated by historical comparisons.
To account for this bias, we used the UN’s “Low” fertility variant. However, this introduced a complication regarding migration effects. The UN provides “Zero Migration” projections, but these are based on the “Medium” fertility scenario, not the “Low” variant we needed.
To resolve this issue, we developed a method to create “Low Fertility, Zero Migration” estimates:
- We first confirmed that the UN uses identical migration figures for both Low and Medium variants:

-
We then calculated the difference between the Medium and Zero Migration variants by age group.
-
Since the migration figures are identical between variants, we could apply this same difference to the Low variant to obtain our desired “Low Fertility, Zero Migration” estimates.
This approach preserved the age-specific migration patterns in the UN data while adjusting for the more realistic fertility projections in the Low variant.
Innovation Index Construction
To measure innovation potential, we created a composite index from four key metrics:
-
Notable scientists from A cross-verified database of notable people, 3500BC-2018AD
- We extracted the number of living figures in Discovery/Science by country as of 2020
- This database draws from Wikipedia across all languages via Wikidata, not just English Wikipedia
-
- Publications in Nature journals, adjusted for author count
- If 10 authors from 10 different countries collaborate on one paper, each country receives a score of 1/10
-
- Total papers published, obtained from Our World In Data
- We converted per-million figures to absolute counts by multiplying by 2020 population
-
- Total patent applications, obtained from Our World In Data
- Similarly converted from per-million to absolute counts
We transformed these metrics into log-count values rather than per-capita measures, as log-counts generally exhibit better statistical properties. Zero values were treated as missing data rather than true zeros, recognizing that small or low-NIQ countries might not register in these metrics due to chance rather than a complete absence of innovation.
We imputed missing values using R’s MICE package and then extracted the first principal component to create our Innovation Index. The resulting index showed strong correlations with all input metrics and with NIQ:
| living | share | papers | patents | innovation_index | niq | |
|---|---|---|---|---|---|---|
| living | 1.000 | 0.845 | 0.827 | 0.727 | 0.912 | 0.699 |
| share | 0.845 | 1.000 | 0.880 | 0.845 | 0.959 | 0.766 |
| papers | 0.827 | 0.880 | 1.000 | 0.811 | 0.946 | 0.788 |
| patents | 0.727 | 0.845 | 0.811 | 1.000 | 0.907 | 0.760 |
| innovation_index | 0.912 | 0.959 | 0.946 | 0.907 | 1.000 | 0.809 |
| niq | 0.699 | 0.766 | 0.788 | 0.760 | 0.809 | 1.000 |
An important characteristic of these innovation metrics is their exponential relationship with NIQ. As NIQ increases, innovation output increases exponentially rather than linearly. This means low-NIQ countries produce disproportionately little innovation, while high-NIQ countries produce disproportionately more. Our log-based index accounts for this non-linearity.
For calculating actual innovative contribution by country, we applied the inverse log operation to convert back to the original scale.
Results
IQ
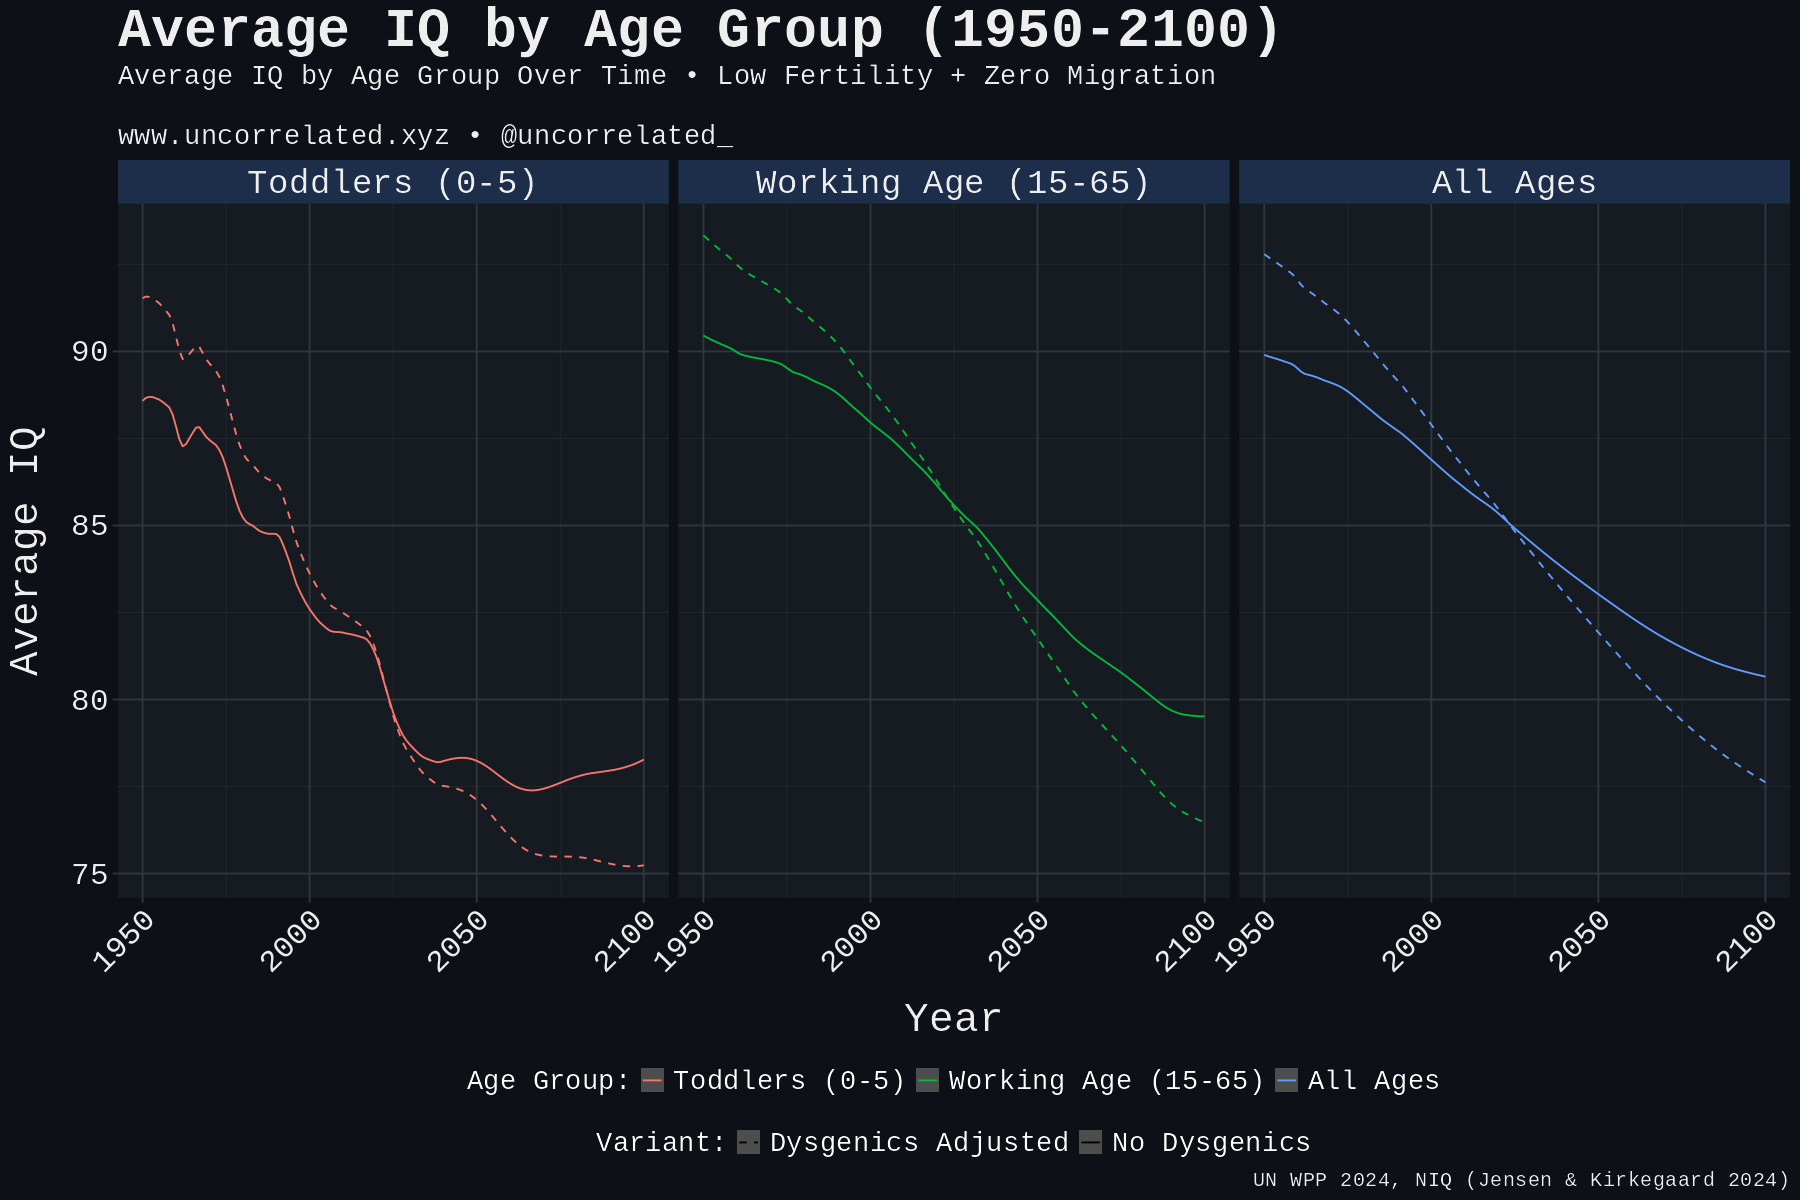
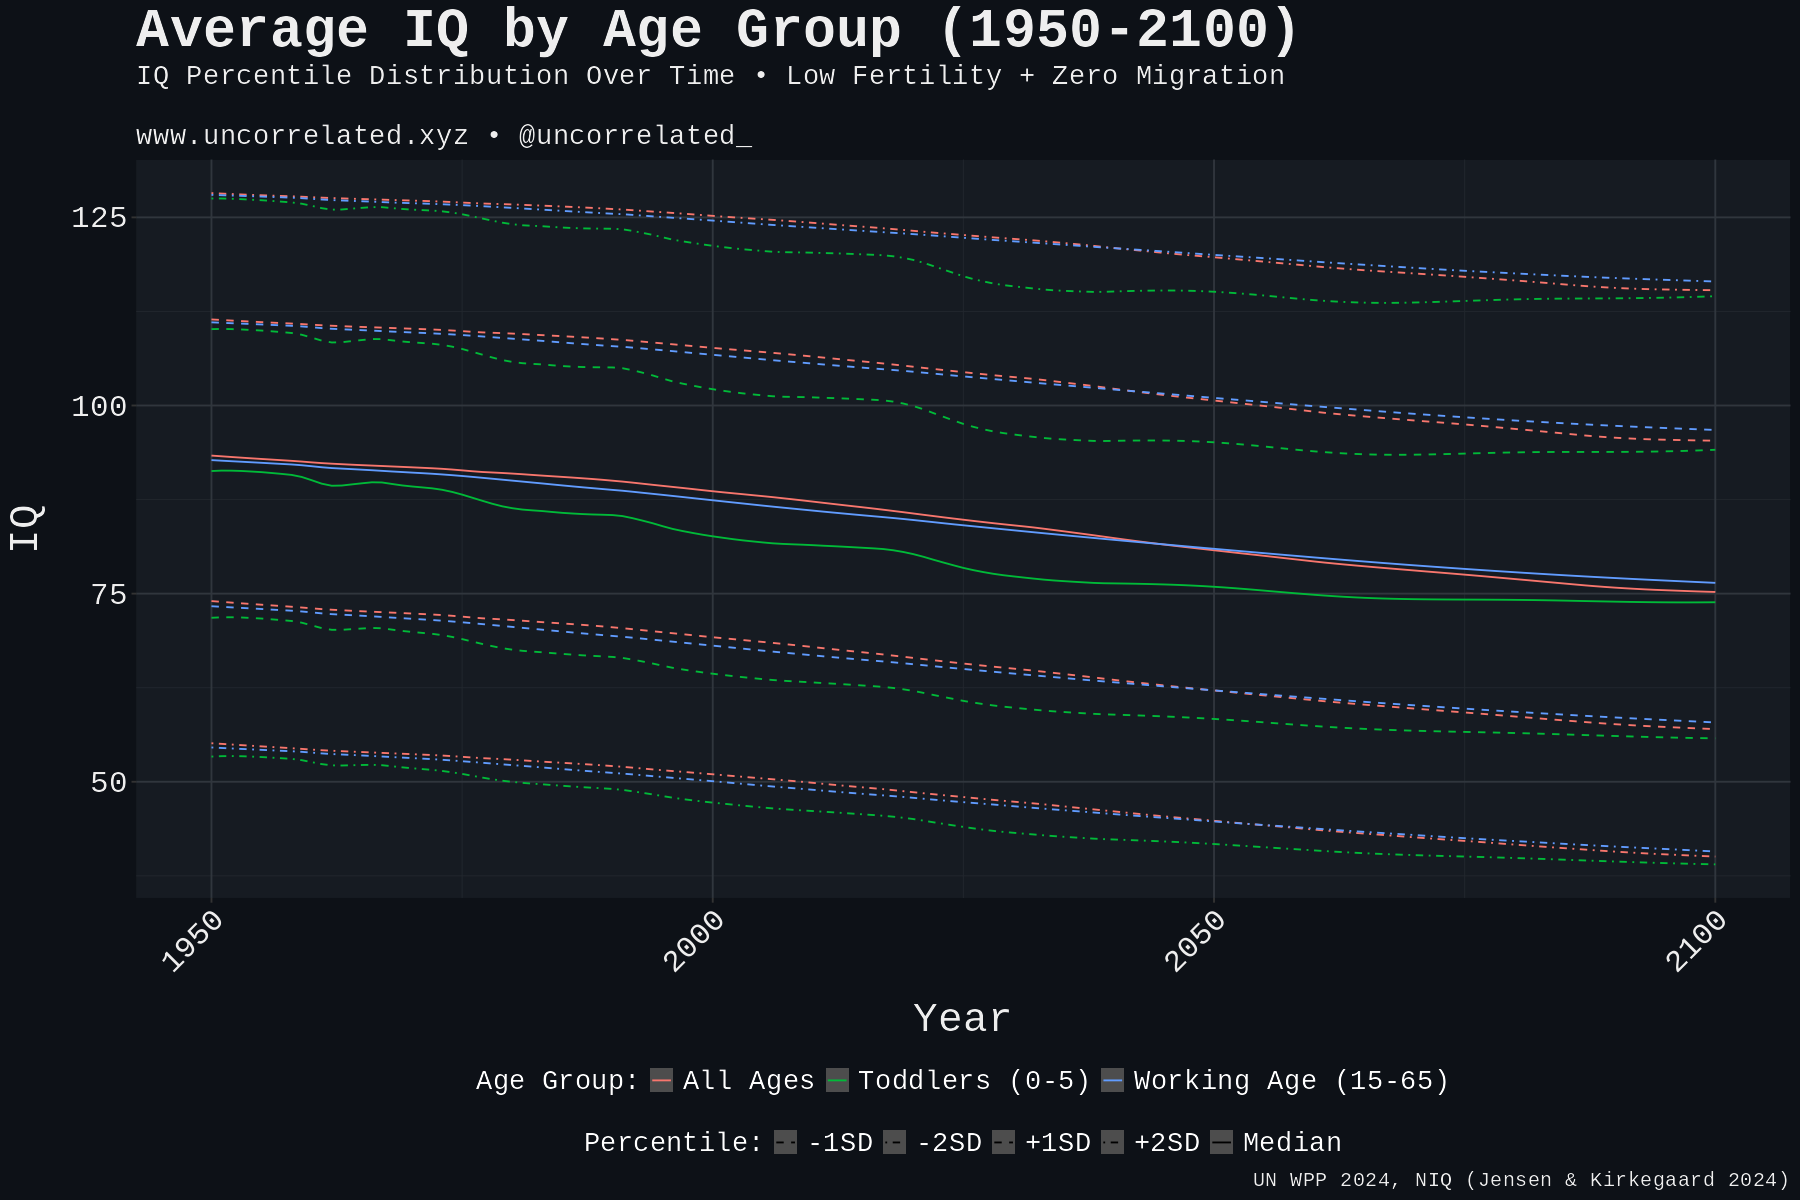
Let’s examine our findings, beginning with a visualization of how the global IQ distribution changes over time:
Our analysis reveals that the average IQ for the working-age population is declining at approximately 1.1 IQ points per decade. Furthermore, dysgenics accounts for 35.5% of this decline, with the remainder attributable to demographic shifts—specifically, higher-fertility populations with lower average IQ becoming a larger proportion of humanity. Among toddlers, the projected decline is even more dramatic, with average IQ falling from about 91 to 75 between 1950 and 2100.
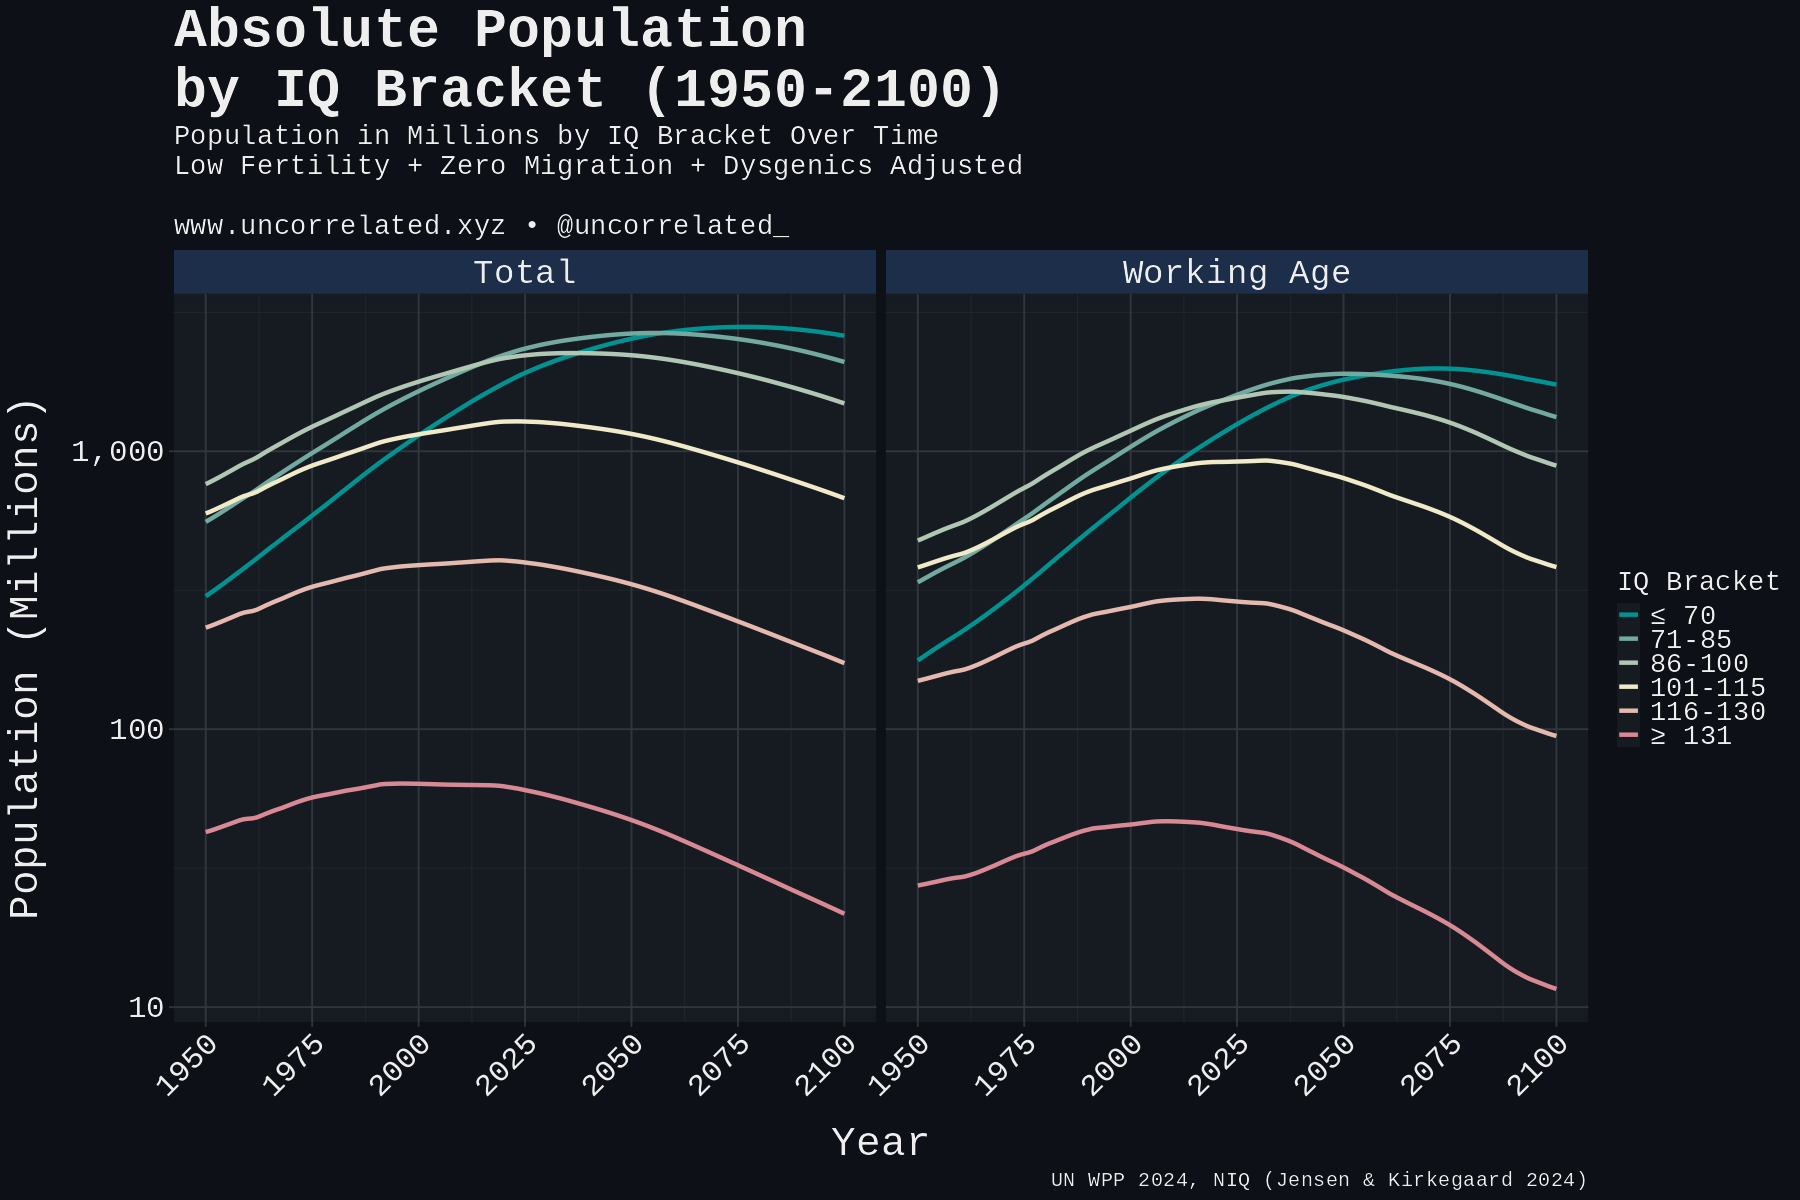
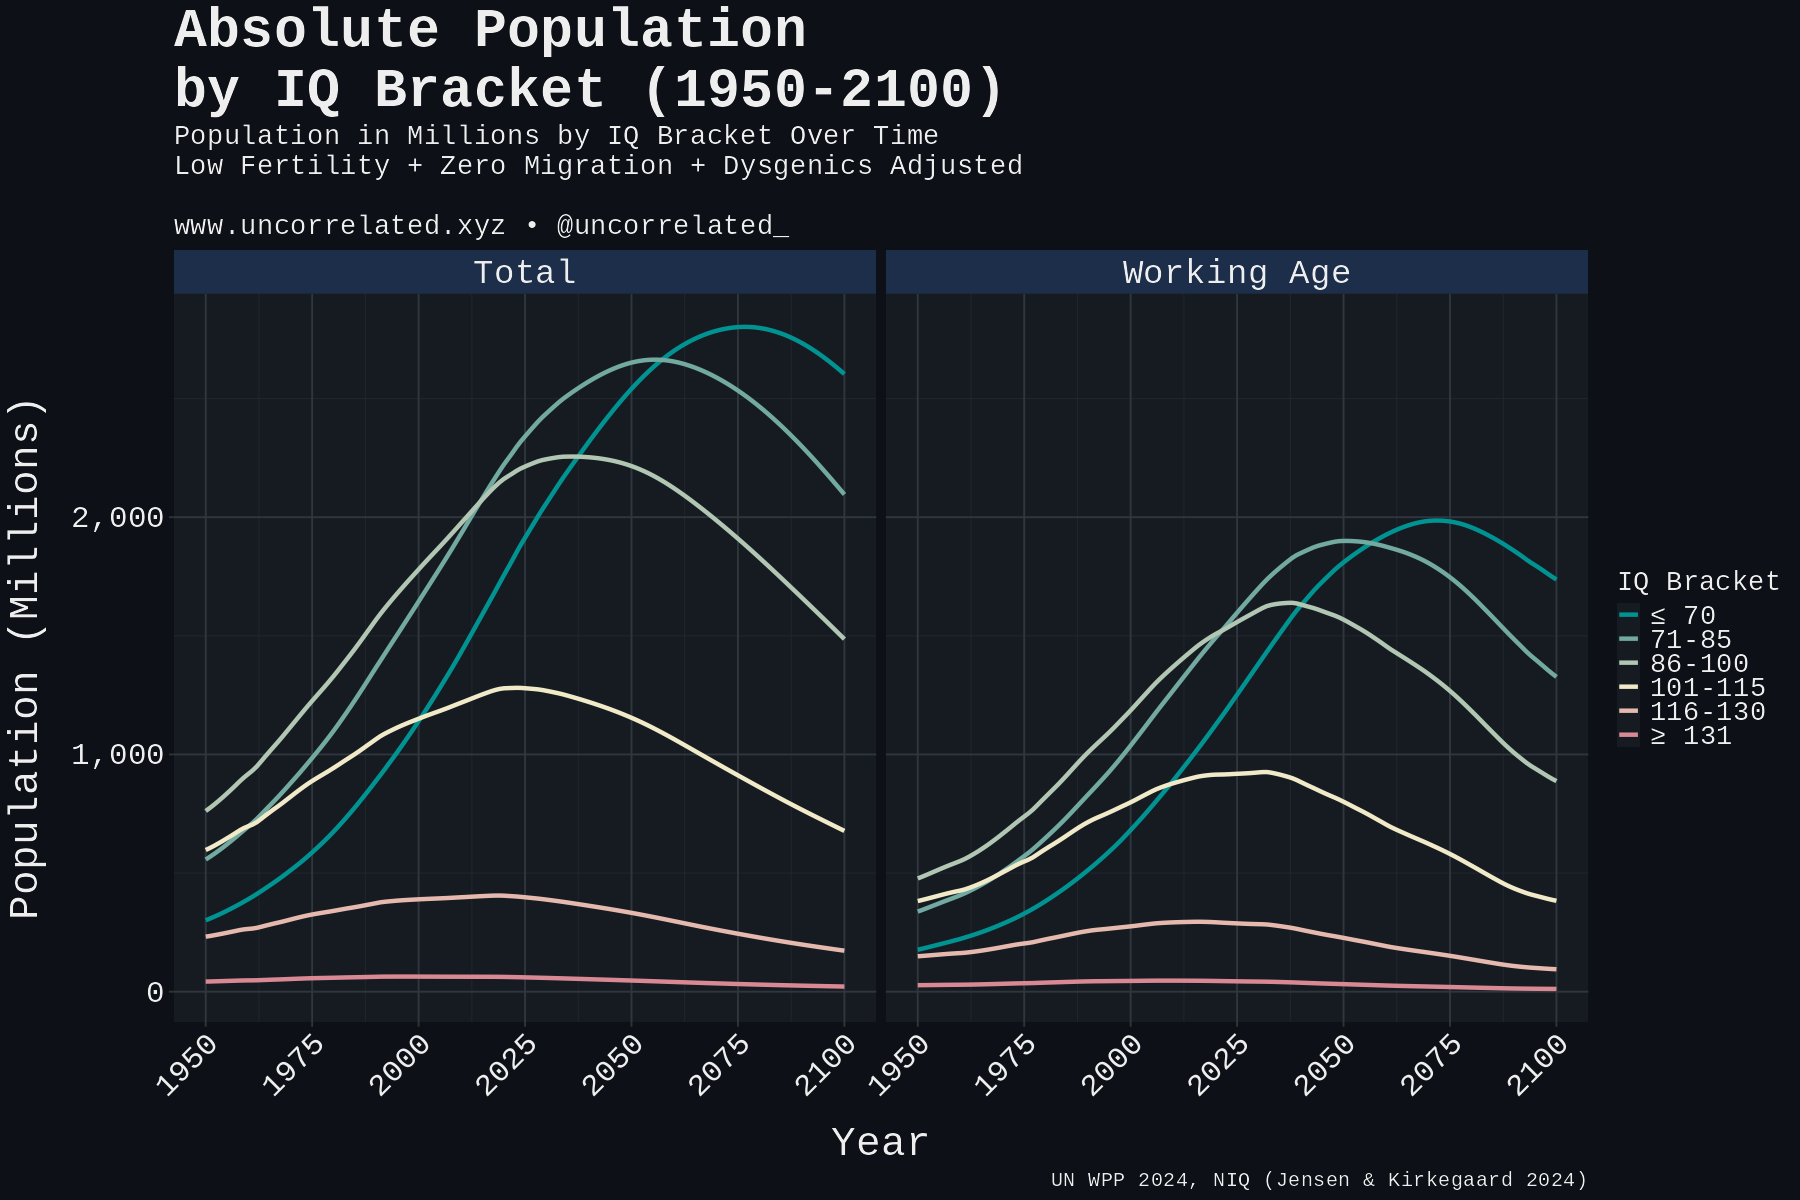
How do these changes affect the actual population distribution across different IQ ranges? Despite shifts in averages, are we seeing meaningful reductions in the number of high-IQ individuals?
This question is challenging to visualize directly because the population with IQ >130 is so small that it’s barely visible when plotted alongside other IQ ranges. To address this, we’ve used a logarithmic scale for the y-axis. The data shows that the working-age population with IQ >115 has already begun declining:
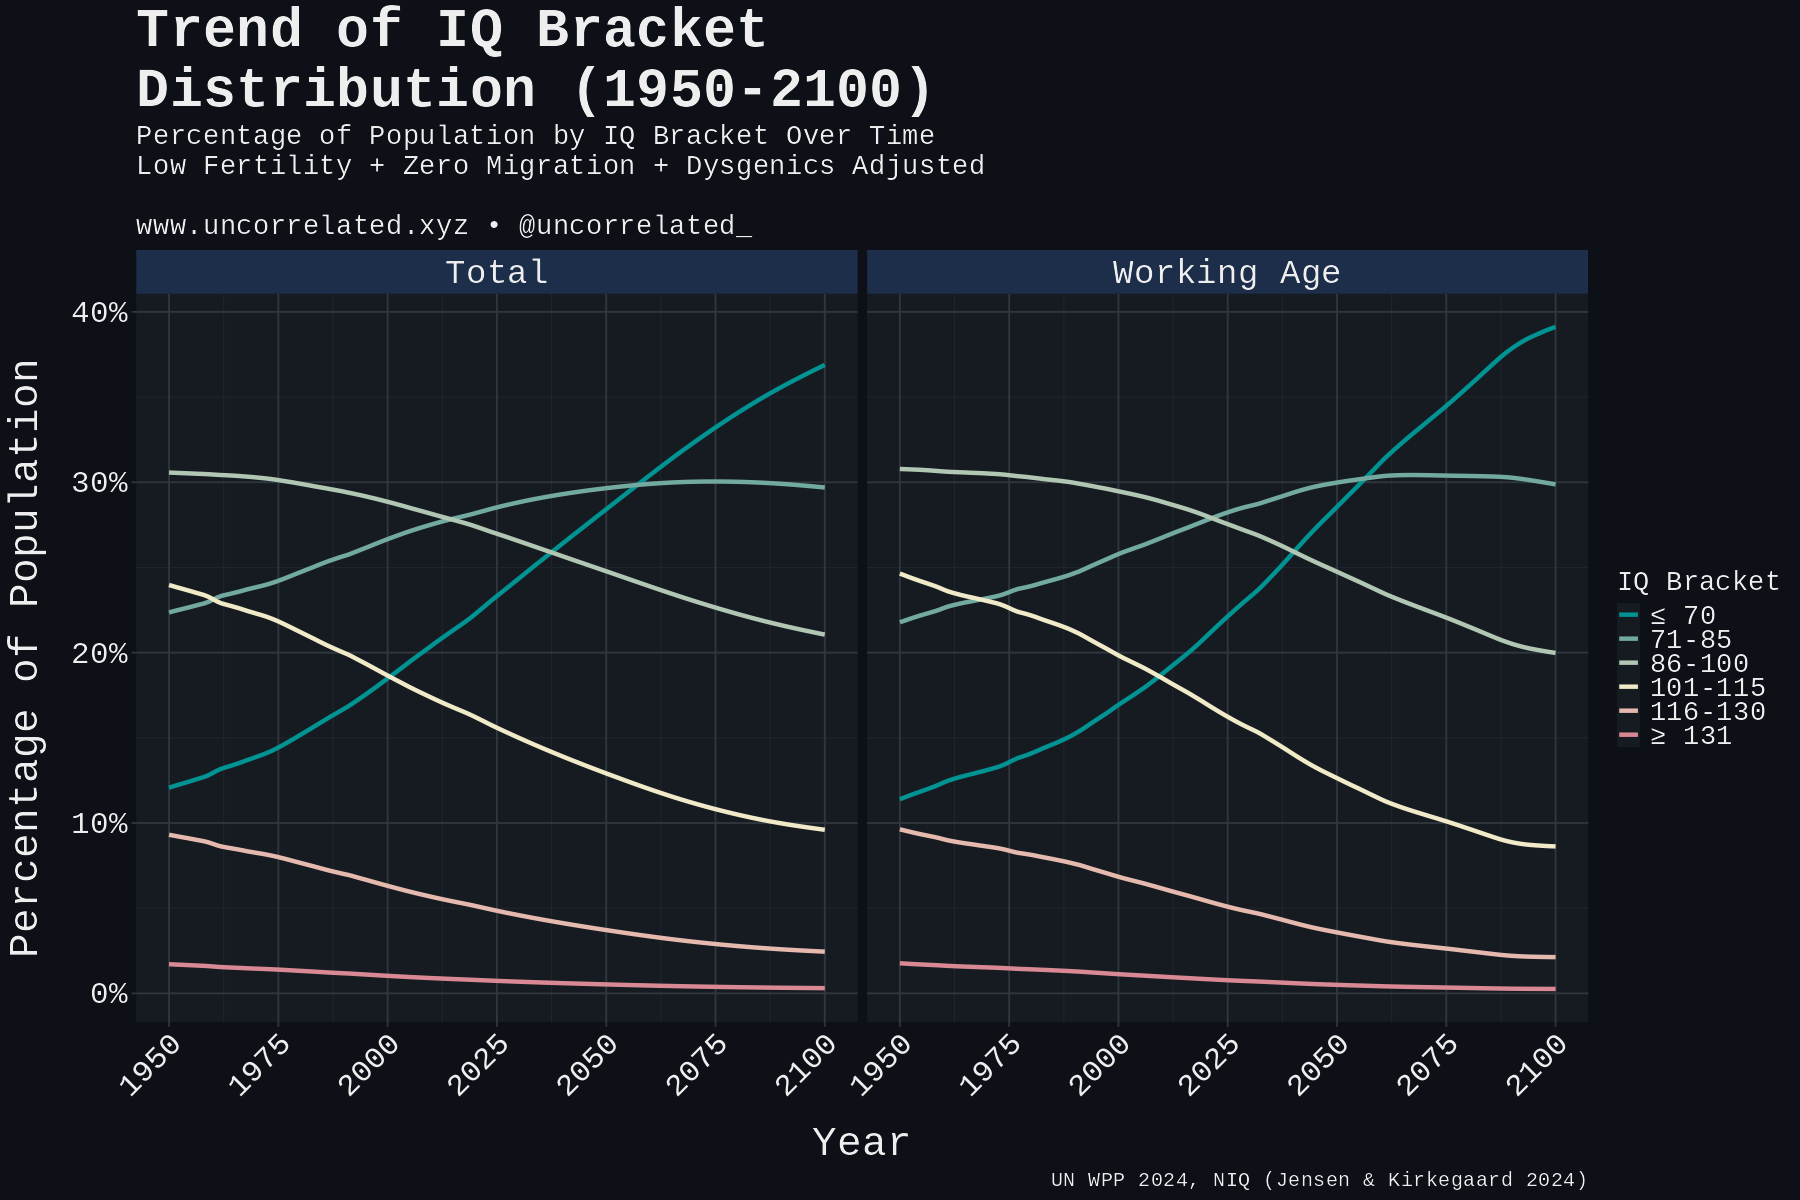
Perhaps most alarming is the changing proportion of the world population at different IQ levels. The proportion with IQ <70, which was once roughly equivalent to the 115-130 bracket, has increased dramatically since the 1950s. By 2100, this group is projected to comprise nearly 40% of the world’s working-age population:
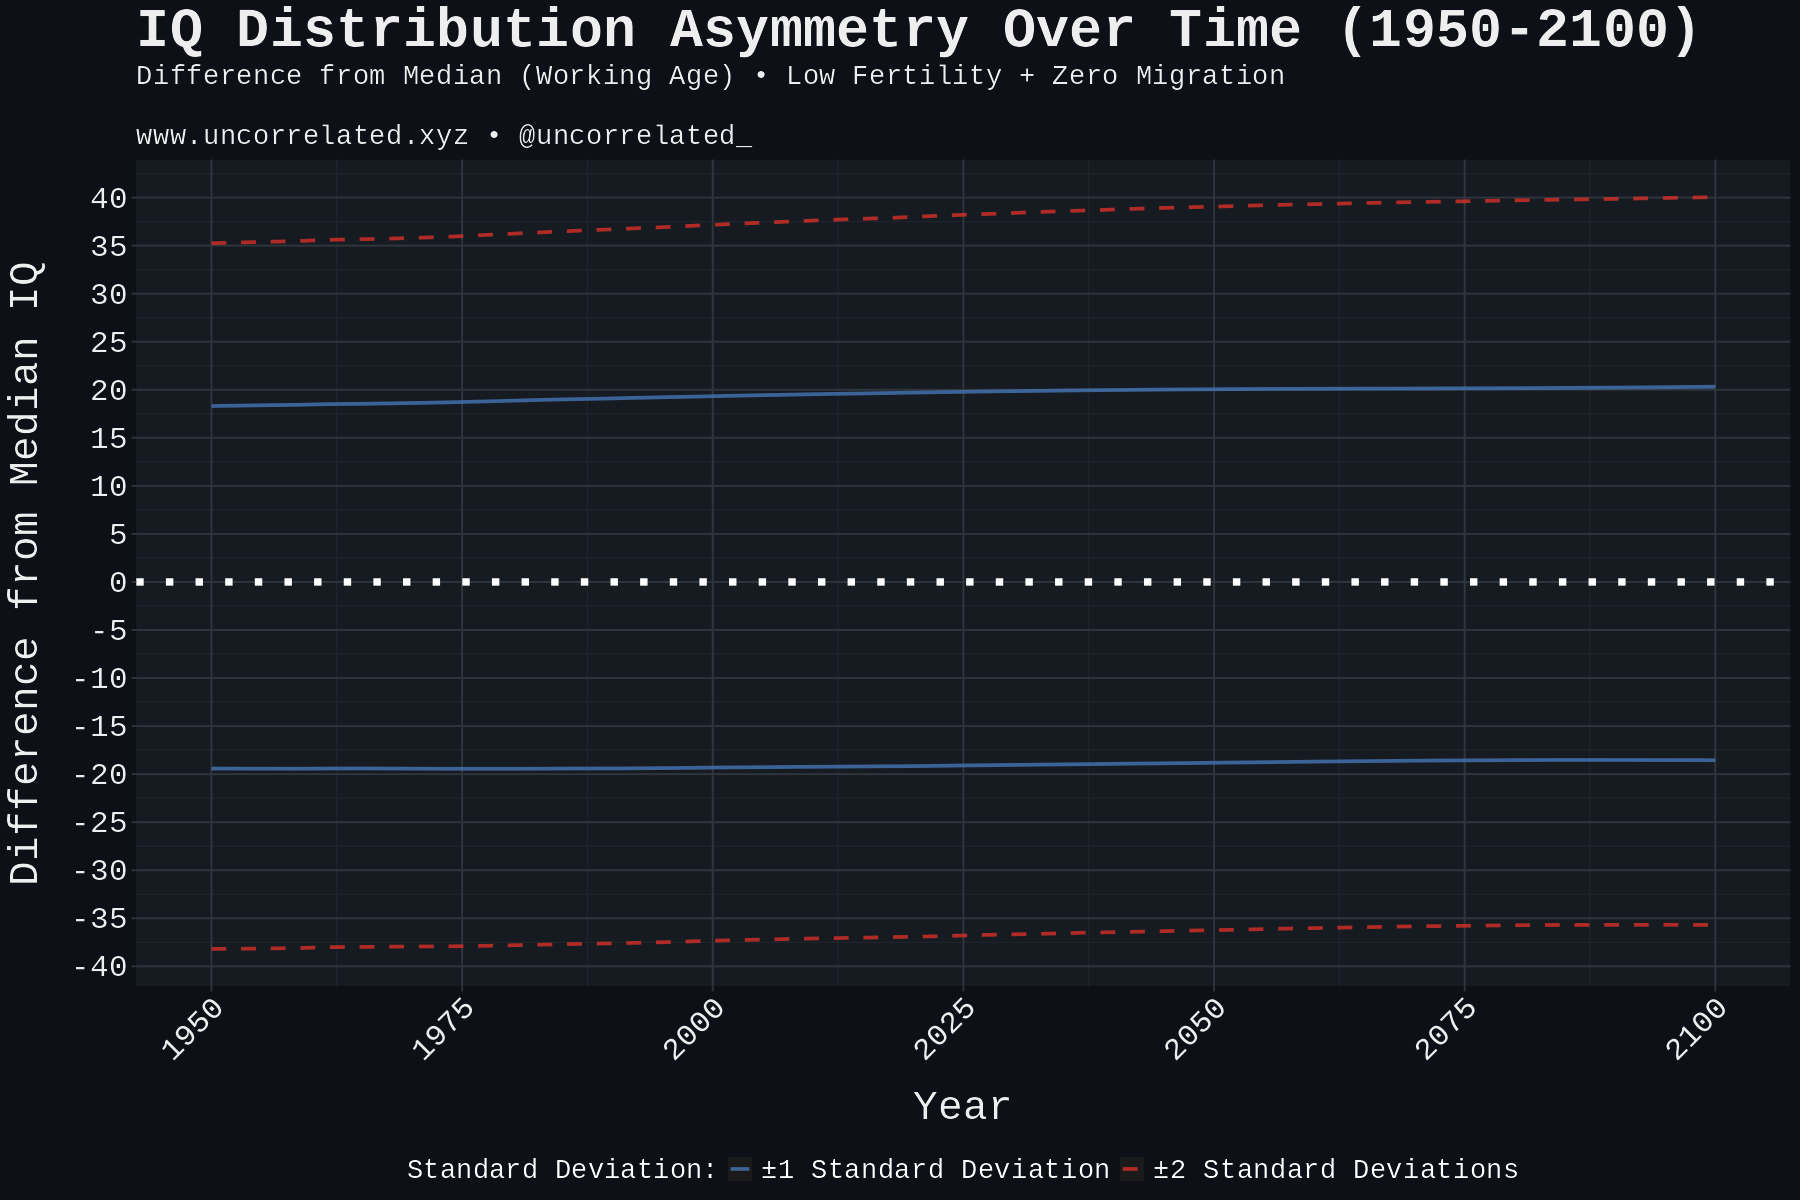
What about the overall distribution of intelligence? While the standard deviation of global IQ remains relatively stable, the shape of the distribution is changing. The symmetry of the normal curve shifts, with the +2SD threshold moving further from the median while the -2SD threshold moves closer, creating a slight right-tail skew in the global IQ distribution:
This shift also means that what constitutes an exceptional or below-average IQ is changing over time. The thresholds for various standard deviations are declining substantially. For example, the +2SD threshold (representing the top 2.3% of the population) drops from approximately 128 to 116:
Innovation
Given these projected changes in global IQ distribution, what are the implications for innovation? Our model suggests that the combination of a smaller working-age population and dysgenics will approximately halve global innovation by 2100 relative to 2023 levels:
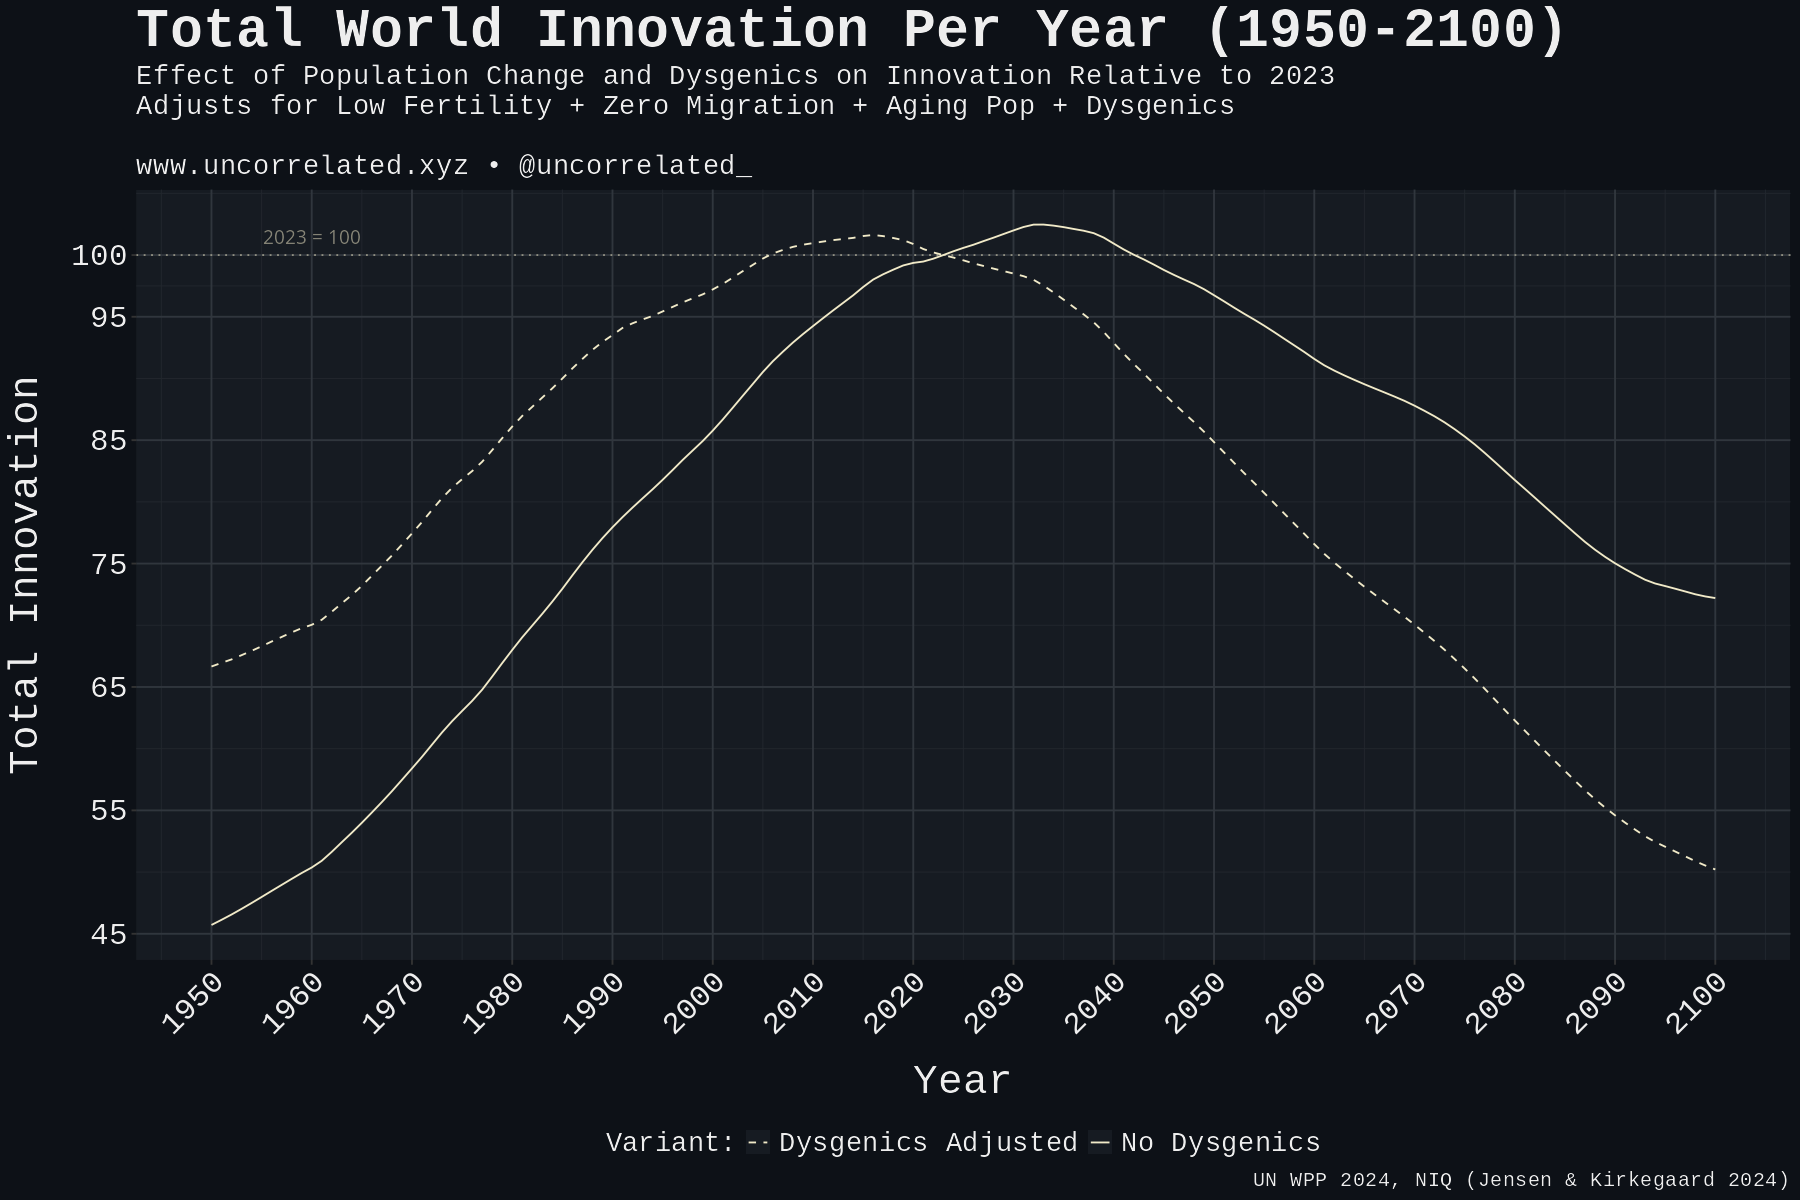
While this decline is certainly undesirable, I must acknowledge that it appears survivable. To quantify the impact, we can calculate the cumulative innovation potential from 2025 to 2100 as “2023-equivalent years”—essentially asking how many years of innovation at 2023 levels we can expect during this 75-year period.
For the scenario without dysgenics, we project approximately 68 years of 2023-level innovation during the 75-year period. With dysgenics factored in, this drops to about 57 years—a loss of roughly 18 years of innovation potential.
This means that even in the dysgenic scenario, humanity retains substantial innovative capacity through the end of the century, though at a reduced level compared to what might have been possible.
Discussion
The projected loss of 18 years of innovation potential this century is relatively modest when viewed in historical context. The remaining 57 years of 2023-equivalent innovation represents substantial creative capacity—equivalent to all progress since 1968 (2025 - 57). That humanity could maintain this level of output despite aging populations and diminishing human capital is noteworthy.
However, our projections may actually underestimate the full impact of dysgenics. As our analysis has shown, selection is occurring against multiple traits associated with human capital, not just IQ. Even if we adjust our estimates to account for this broader effect—perhaps increasing the innovation loss to 25 years out of 75—there still appears to be sufficient time for transformative technological developments.
Consider the remarkable advances in AI and genetics over the past half-century, or even the extraordinary progress in AI capabilities just within the last five years. The pace of technological change suggests that even with reduced human capital, breakthrough innovations remain possible.
Beyond technological acceleration, several demographic and developmental factors could mitigate the projected decline in innovation:
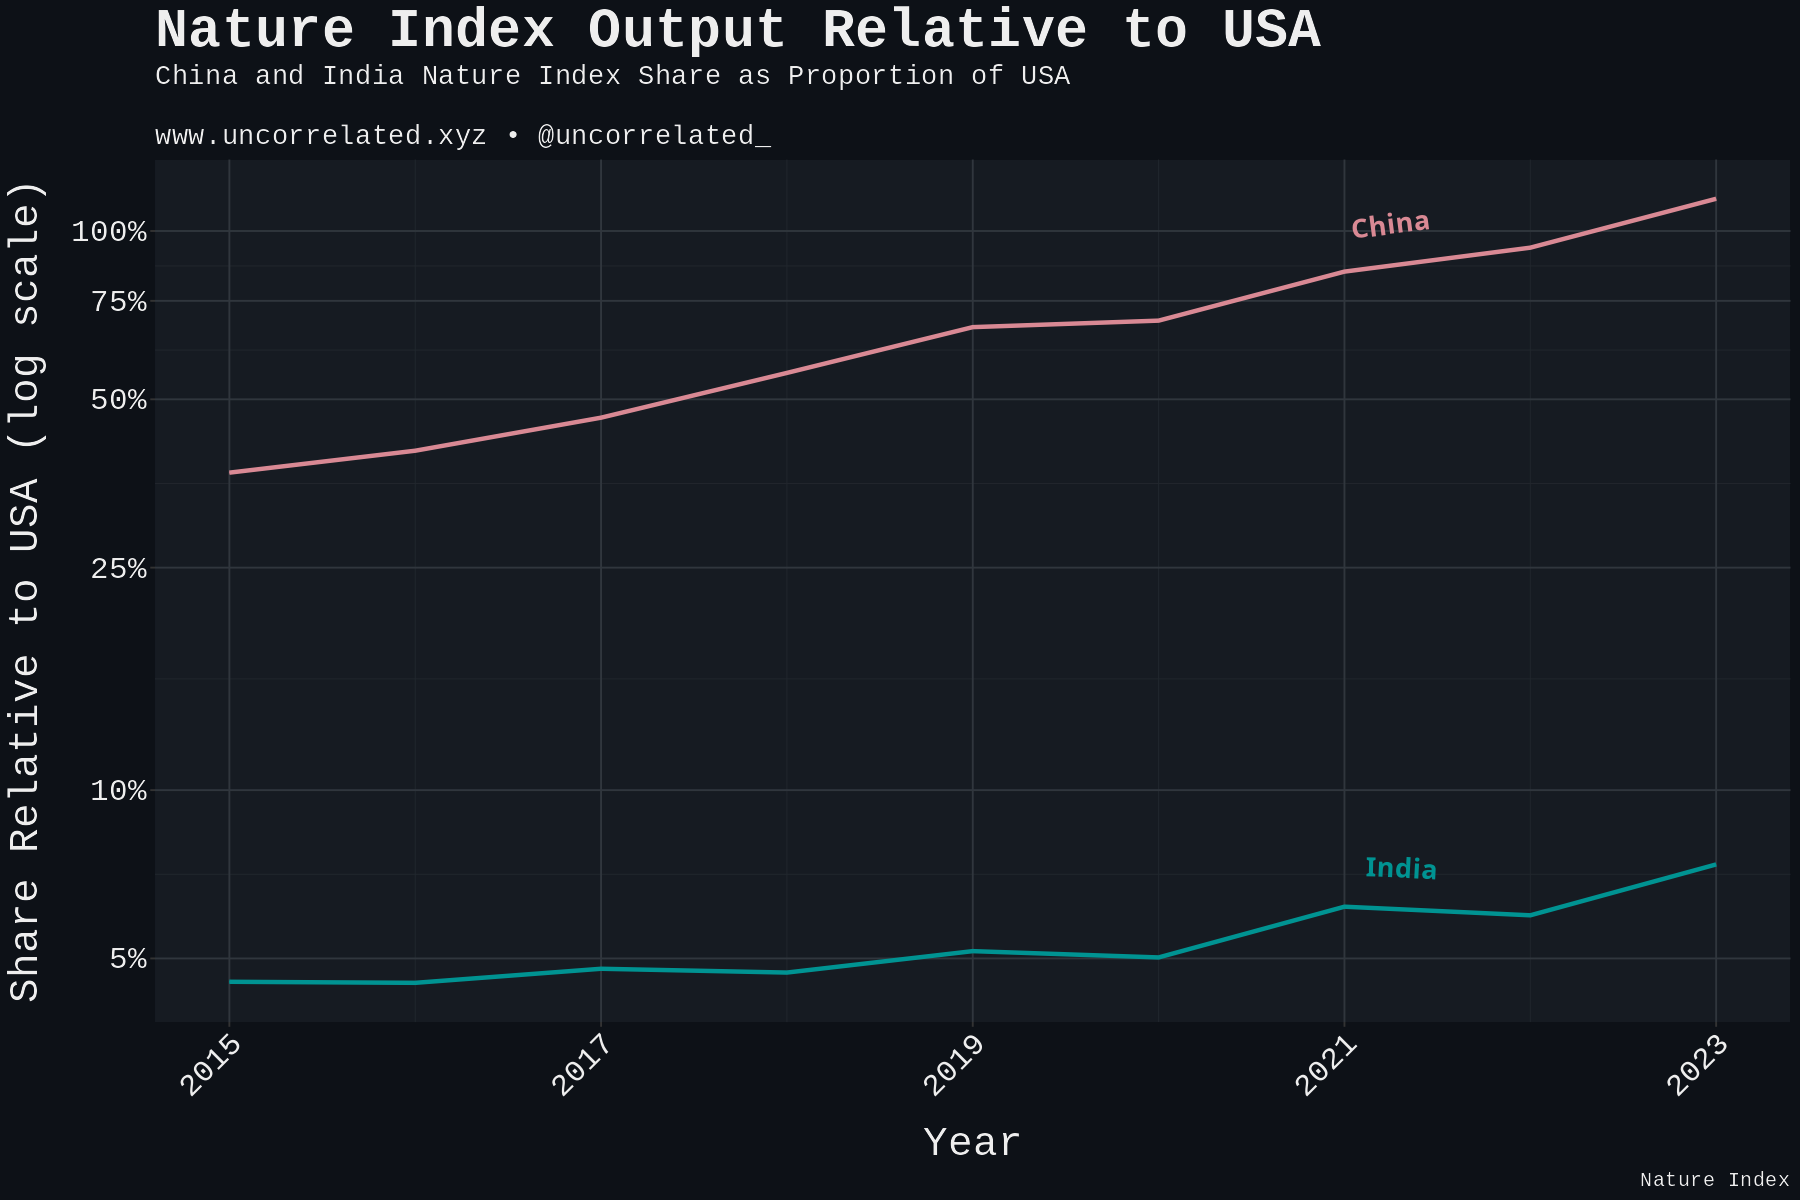
China’s emergence as a scientific powerhouse represents one such counterbalance. Its share in the Nature Index has grown by approximately 15% annually for nearly a decade, resulting in a dramatic shift in the global innovation landscape. China now produces about 14% more papers in Nature than the entire United States—a remarkable reversal from just a few years ago when its output was less than half that of the US.
This transformation is particularly significant given the strong correlation (r=0.95) between the Nature Index and our broader innovation measure, suggesting that China’s rise represents a genuine increase in innovative capacity rather than merely bibliometric inflation.
The Chinese example suggests that economic development can unlock latent innovative potential in populations. This pattern could potentially extend to other developing nations as their GDP per capita increases. While human capital constraints will present challenges, countries with large populations like India—projected to approach 2 billion people this century—could collectively contribute innovation equivalent to multiple European countries combined if they follow a similar developmental trajectory.
This developmental effect applies not only to countries but to individuals as well. When talented people from lower-resource environments migrate to contexts with better research infrastructure and opportunities, they may realize more of their innovative potential. This mobility effect could partially offset the impact of dysgenics within populations.
Taken together, these factors—technological acceleration, the rise of developing nations, and human capital mobility—provide reasonable grounds for cautious optimism despite the concerning trends in global IQ and fertility.
Conclusion
In conclusion, it’s likely that dysgenics and declining fertility will have a meaningful impact on global innovation and human capital in the coming decades. Our analysis projects a halving of innovation by 2100 relative to 2023 levels, with a loss of approximately 18 years of innovation potential this century.
However, this forecast should be viewed with cautious optimism. The projected 57 years of 2023-equivalent innovation remaining this century still represents substantial progress. For context, the last 57 years have transformed our world beyond recognition through computing, the internet, mobile technology, and the beginnings of AI.
Several factors could mitigate or even reverse these trends:
First, the rise of China and potentially other developing nations demonstrates that economic development can dramatically increase innovative output relative to developed countries. As more countries develop robust infrastructures pertaining to innovation, they may unlock previously untapped human potential.
Second, migration from lower to higher-resource environments may allow talented individuals to better realize their capabilities, partially offsetting the effects of dysgenics within populations.
Third, and perhaps most significantly, technological acceleration itself could render these projections obsolete. AI systems are already enhancing human productivity across multiple domains. If this trend continues, even a smaller pool of high-IQ individuals might achieve more than larger populations could in previous eras.
The feedback loop between dysgenics, declining fertility, and reduced innovation remains a legitimate concern. However, the window for technological breakthroughs that could break this cycle appears sufficiently wide. With 57 years of substantial innovation ahead, humanity has time to develop solutions to these demographic challenges—whether through advanced AI, genetic technologies, or social innovations that reverse fertility trends among high-capability individuals.
The future remains uncertain, but that uncertainty itself is cause for hope. Just as no one in 1968 could have predicted our current technological landscape, the innovations of the coming decades may well transform our understanding of human potential and productivity in ways we cannot yet imagine.
References
- Hugh-Jones D, Abdellaoui A. Human Capital Mediates Natural Selection in Contemporary Humans. Behav Genet. 2022 Sep;52(4-5):205-234. doi: 10.1007/s10519-022-10107-w. Epub 2022 Jul 6. Erratum in: Behav Genet. 2022 Sep;52(4-5):235. doi: 10.1007/s10519-022-10110-1. PMID: 35790706; PMCID: PMC9463317.
- Hugh-Jones D, Edwards T. Natural Selection Across Three Generations of Americans. Behav Genet. 2024 Sep;54(5):405-415. doi: 10.1007/s10519-024-10189-8. Epub 2024 Jul 11. PMID: 38990442.
- Jensen, S., Pesta, B. J., Francis, G., & Kirkegaard, E. O. W. (2023). International meta-analysis of differential fertility for intelligence. Open Psych. https://osf.io/2fb4p/
- Skirbekk, Vegard. (2008). Fertility Trends by Social Status. Demographic Research. 18. 145-180. 10.4054/DemRes.2008.18.5.
- Jensen, S., & Kirkegaard, E. O. W. (2024). National IQs and socioeconomic development. PsyArXiv. https://doi.org/10.31234/osf.io/bx86g