Table of Contents
Note, this post was written with the assistance of Gemini 2.5 Pro. All data was sourced by me, as were the plots, model designs, Gemini assisted with writing
TL;DR
- Frequency > Length: Posting more often (even daily) seems better than writing fewer, longer posts. Consistency in timing isn’t key, but volume is.
- Price Matters: Higher average subscription prices strongly correlate with higher estimated revenue.
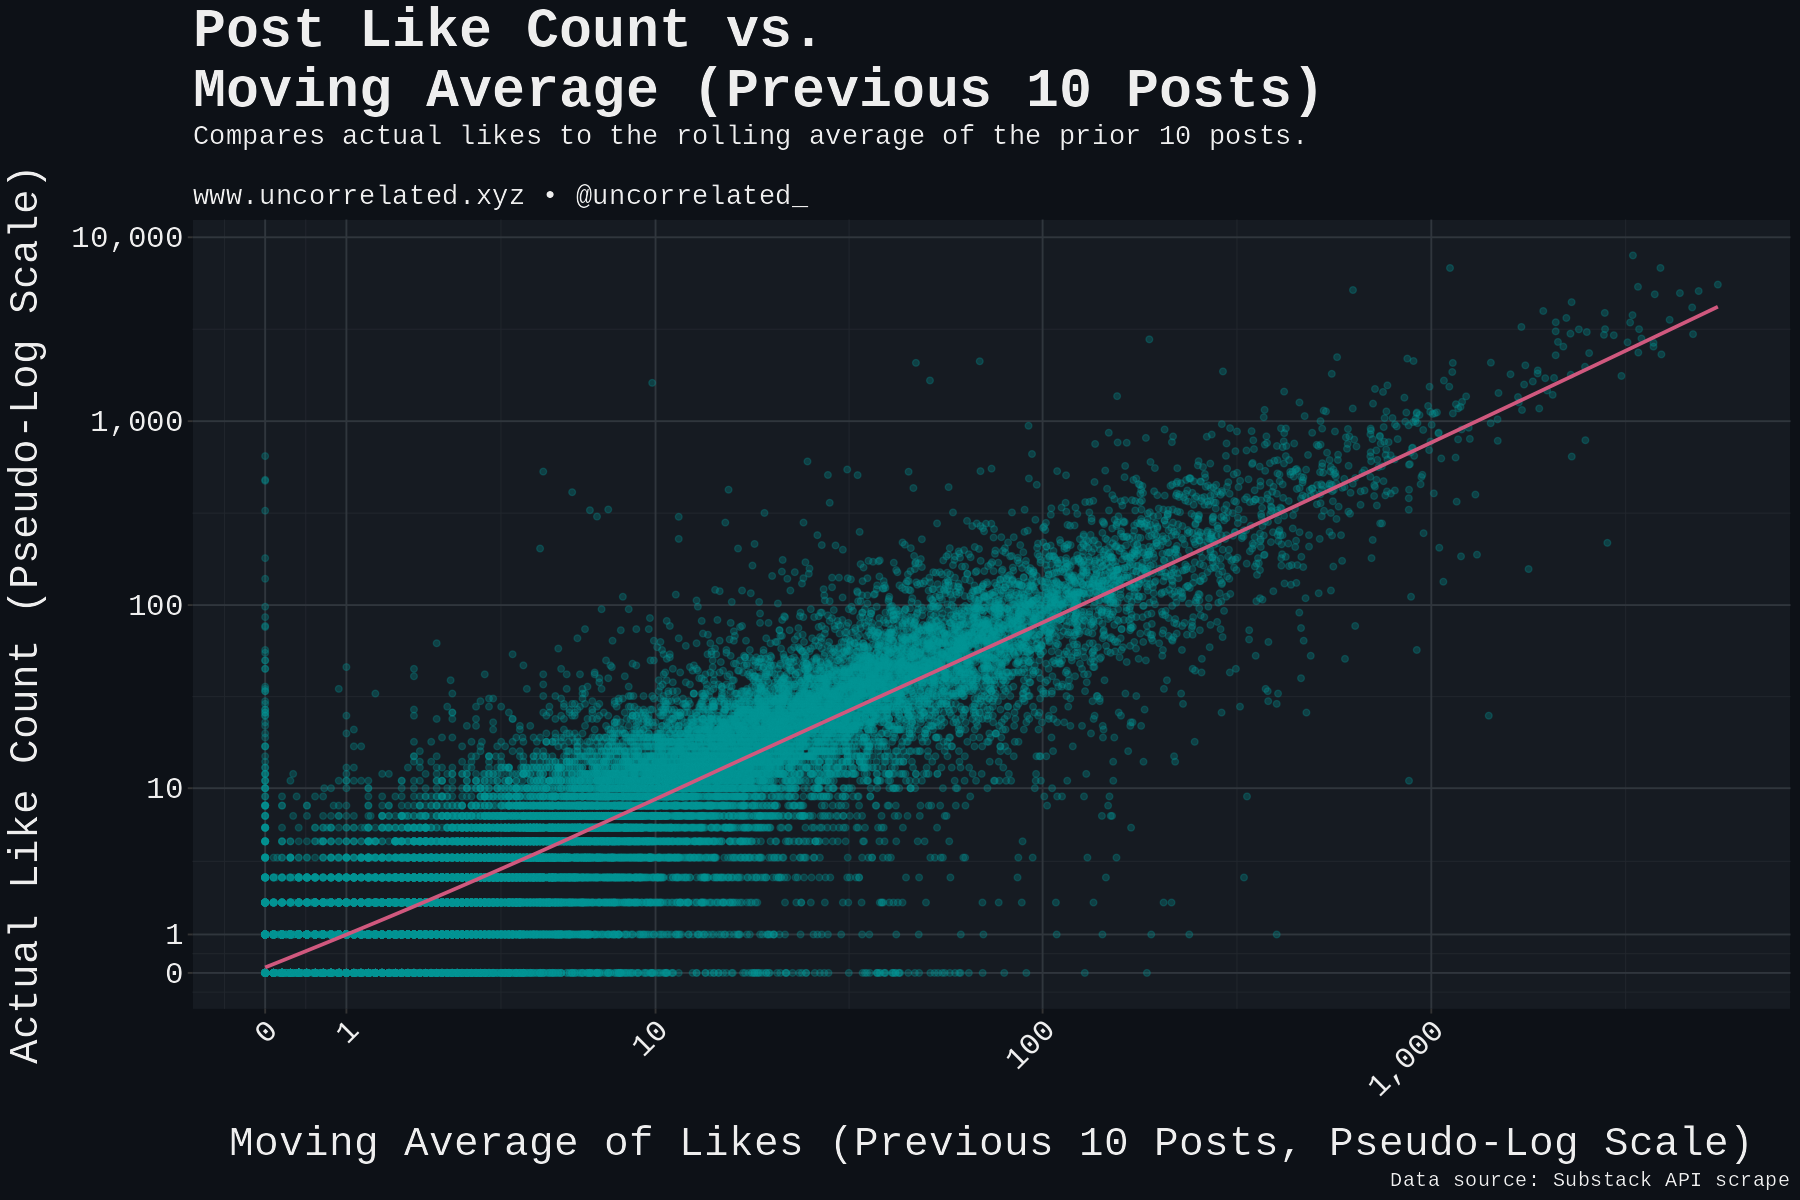
- Momentum is Real: A post’s likes are overwhelmingly predicted by the average likes of the previous 10 posts (explaining ~86% of the variance!).
- Substack Boosts the First Post: Your first post gets a huge boost – make it count.
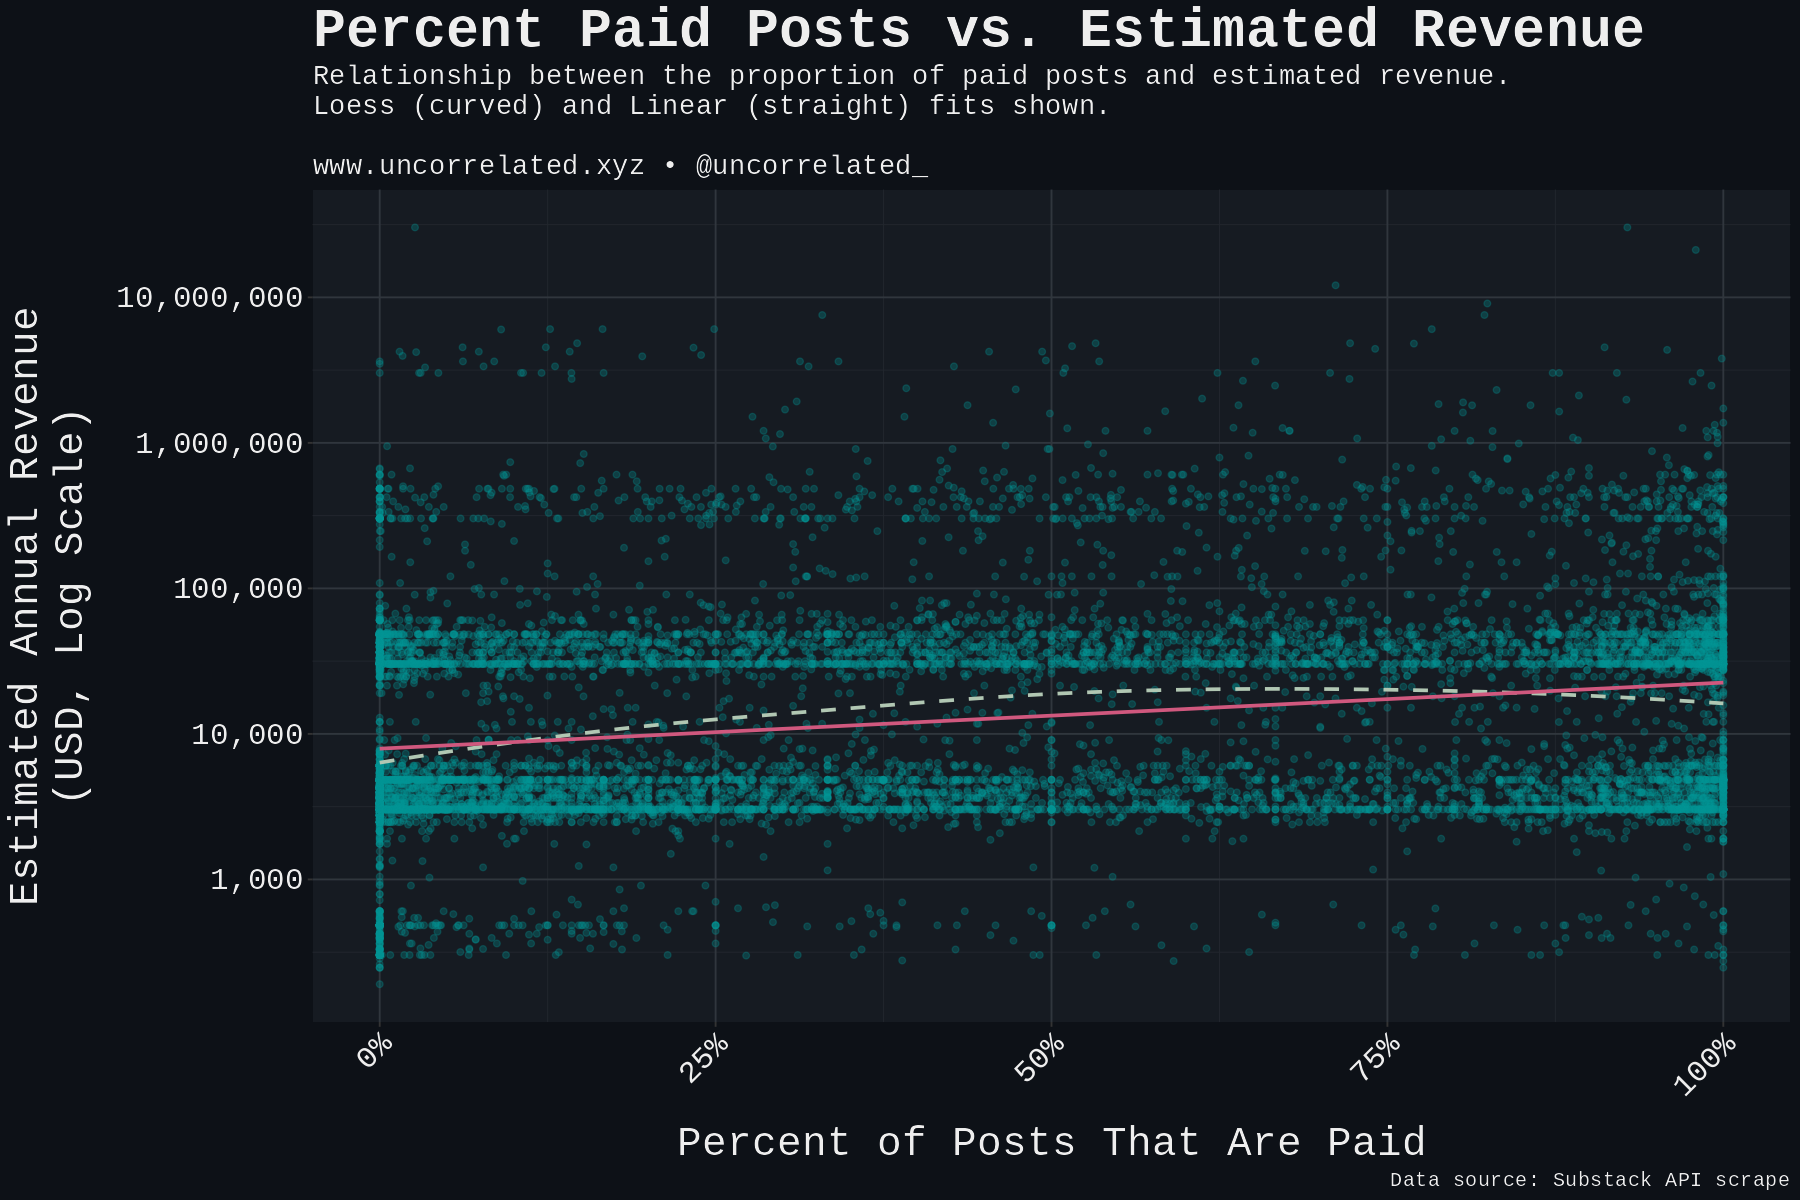
- Paid Post Sweet Spot: Aiming for roughly 50% paid posts appears optimal for maximizing revenue, though the relationship isn’t perfectly linear.
- Category Counts: Culture, US Politics, and Finance Substacks tend to have higher revenue potential, while Fiction, Philosophy, and Travel lag behind in our model. For individual posts, Comics and Health Politics see the biggest like boosts relative to the baseline (Arts).
Introduction
Substack has exploded, becoming a go-to platform for writers, journalists, and creators looking to build direct relationships with their audience and monetize their work. But with thousands of newsletters vying for attention, what actually separates the breakout hits from the ones that fizzle out?
Is it brilliant prose? Niche topics? A relentless posting schedule? Or just plain luck?
As usual, rather than relying on anecdotes, we decided to dive into the data. We scraped information from a vast number of Substack publications and their posts, connecting it with backend data on pricing, subscriber counts (where available), and post statistics. We then built a couple of models to try and decode the patterns behind Substack success:
- Predicting Substack Revenue: What publication-level factors (price, age, frequency, category, etc.) correlate with higher estimated earnings?
- Predicting Post Likes: What makes an individual post resonate more with readers (length, paid status, timing, category)?
Let’s see what the numbers tell us.
Method
To tackle this, we gathered data on posts (like counts, word counts, publish dates, paid status) and publications (subscriber estimates, pricing plans, categories, creation dates).
- Data Prep: We cleaned the data, converted currencies to USD, calculated average subscription prices, and estimated revenue based on Substack’s own “Paid Rank” tiers (e.g., “Thousands of paid subscribers” ~ 1000). We focused only on non-podcast newsletter posts.
- Substack Revenue Model: We built a linear regression model predicting the (log-transformed and standardized) lower-bound estimated annual revenue. Predictors included average price, publication age (observation period), average time between posts, variance in time between posts, percentage of paid posts, average word counts (imputed where necessary), average description length, and category.
- Post Likes Model: We built another linear regression model, this time predicting the (log-transformed) number of likes (reactions) on a post. Predictors included word count, description length, paid status, category, whether it was the first post, and crucially, the moving average of likes from the previous 10 posts.
We used standard statistical techniques, including log transformations to handle skewed data (like revenue and likes) and imputation for missing values. The goal wasn’t perfect prediction but identifying significant drivers.
Results: What Drives Substack Success?
Predicting Which Substacks Earn More
Our model looking at publication-level revenue (Adjusted R-squared: 0.314, r=0.56, meaning it explains about 31.4% of the variance) revealed several significant factors:
| Factor | Estimate (Effect Size) | Std. Error | Statistic | P-value | Interpretation |
|---|---|---|---|---|---|
| (Intercept) | -1.80 | 0.115 | -15.7 | < 0.001 *** | Baseline revenue potential |
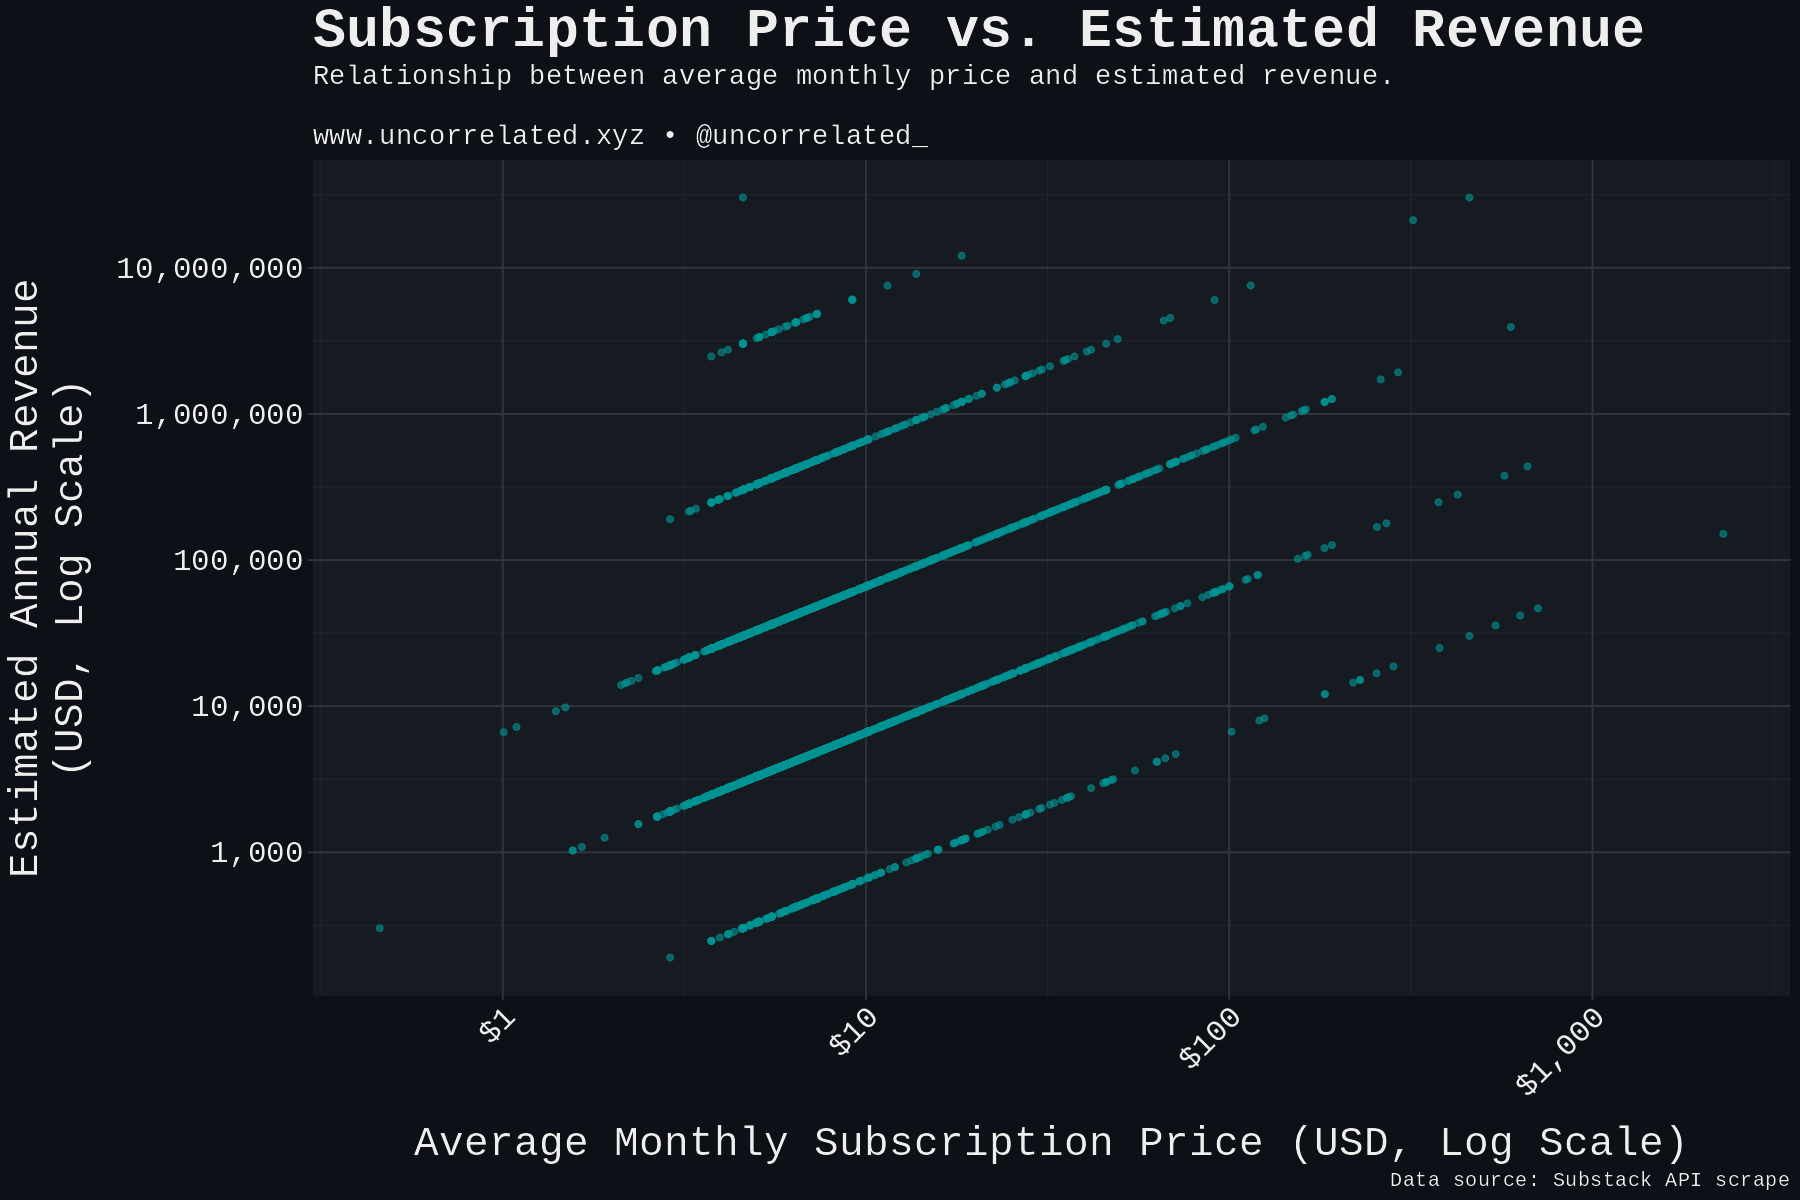
| Average Price (log) | 0.466 | 0.0202 | 23.1 | < 0.001 *** | Higher price = Higher revenue (Strong effect) |
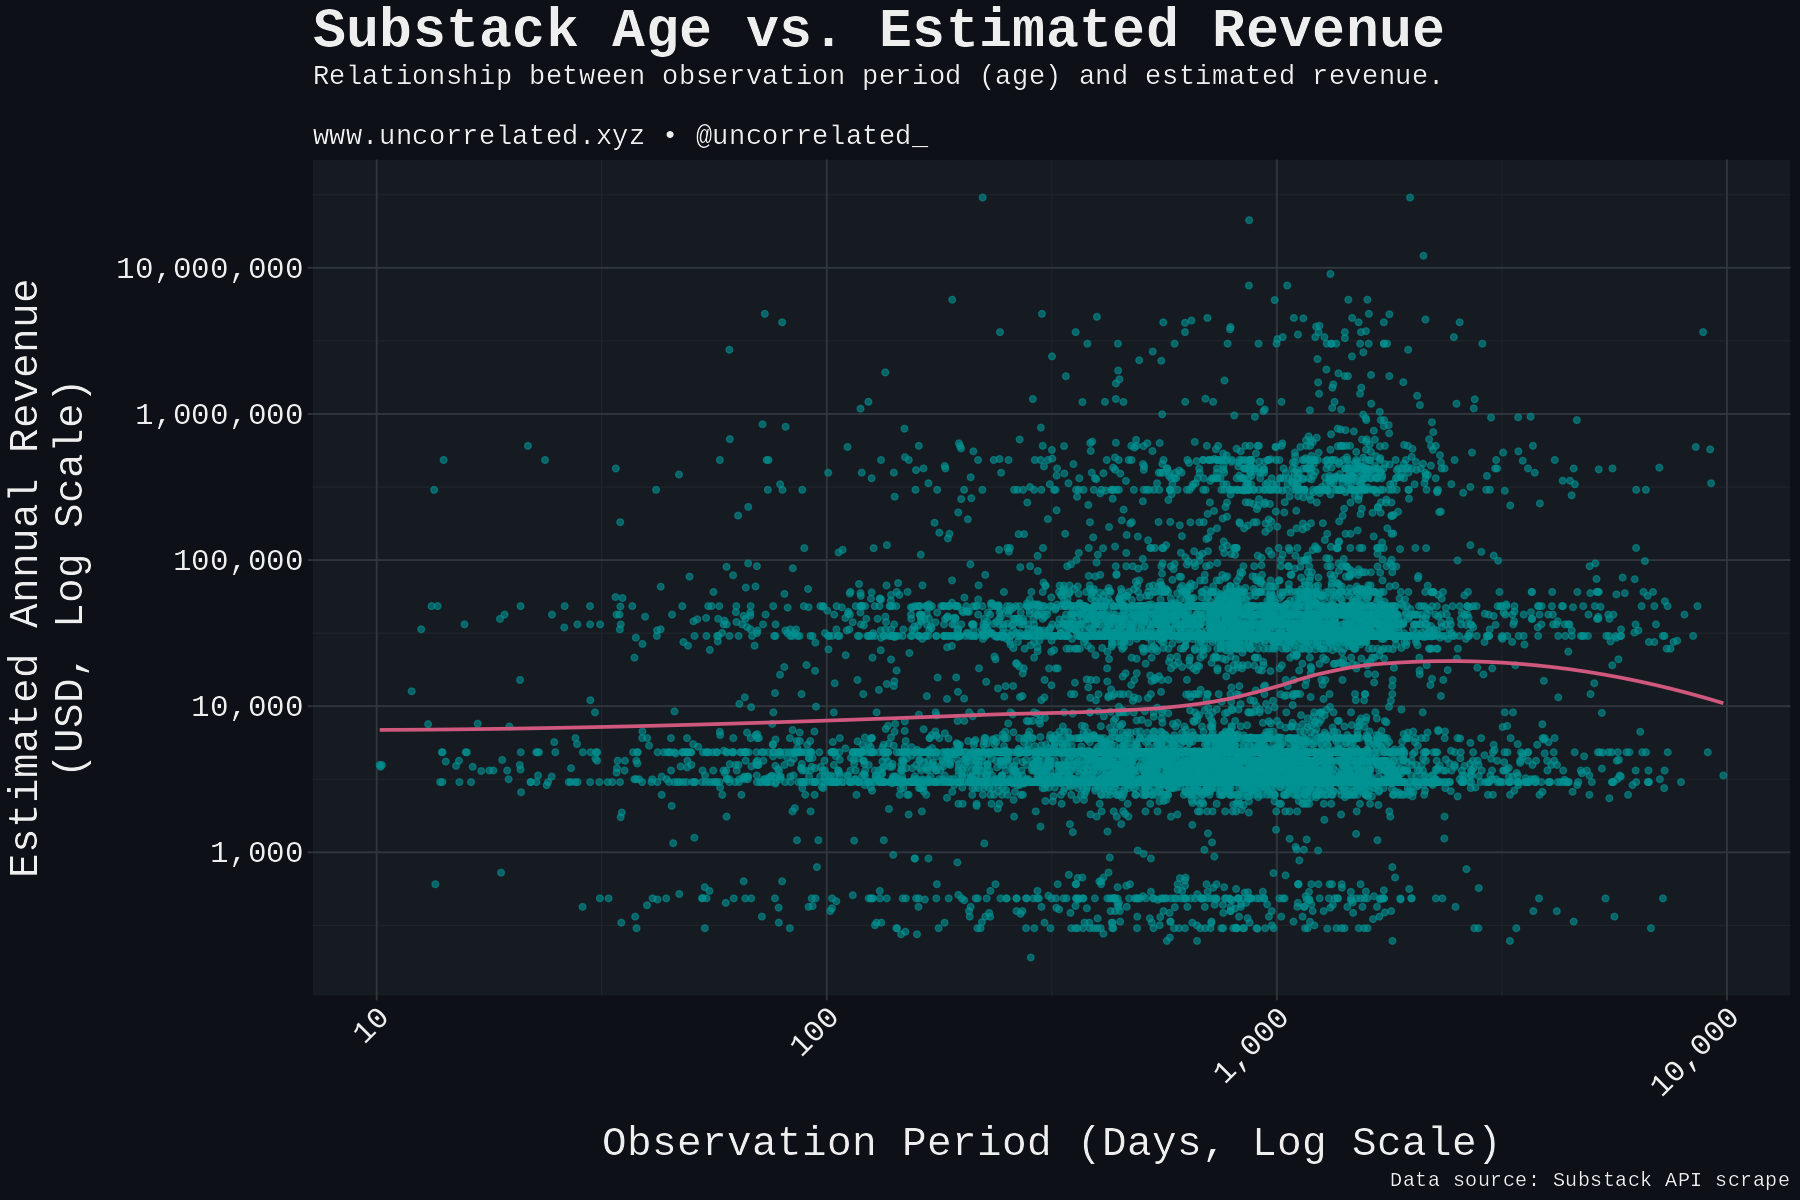
| Observation Period (Days) | 0.00000448 | 0.0000008 | 5.61 | < 0.001 *** | Older Substacks tend to earn slightly more |
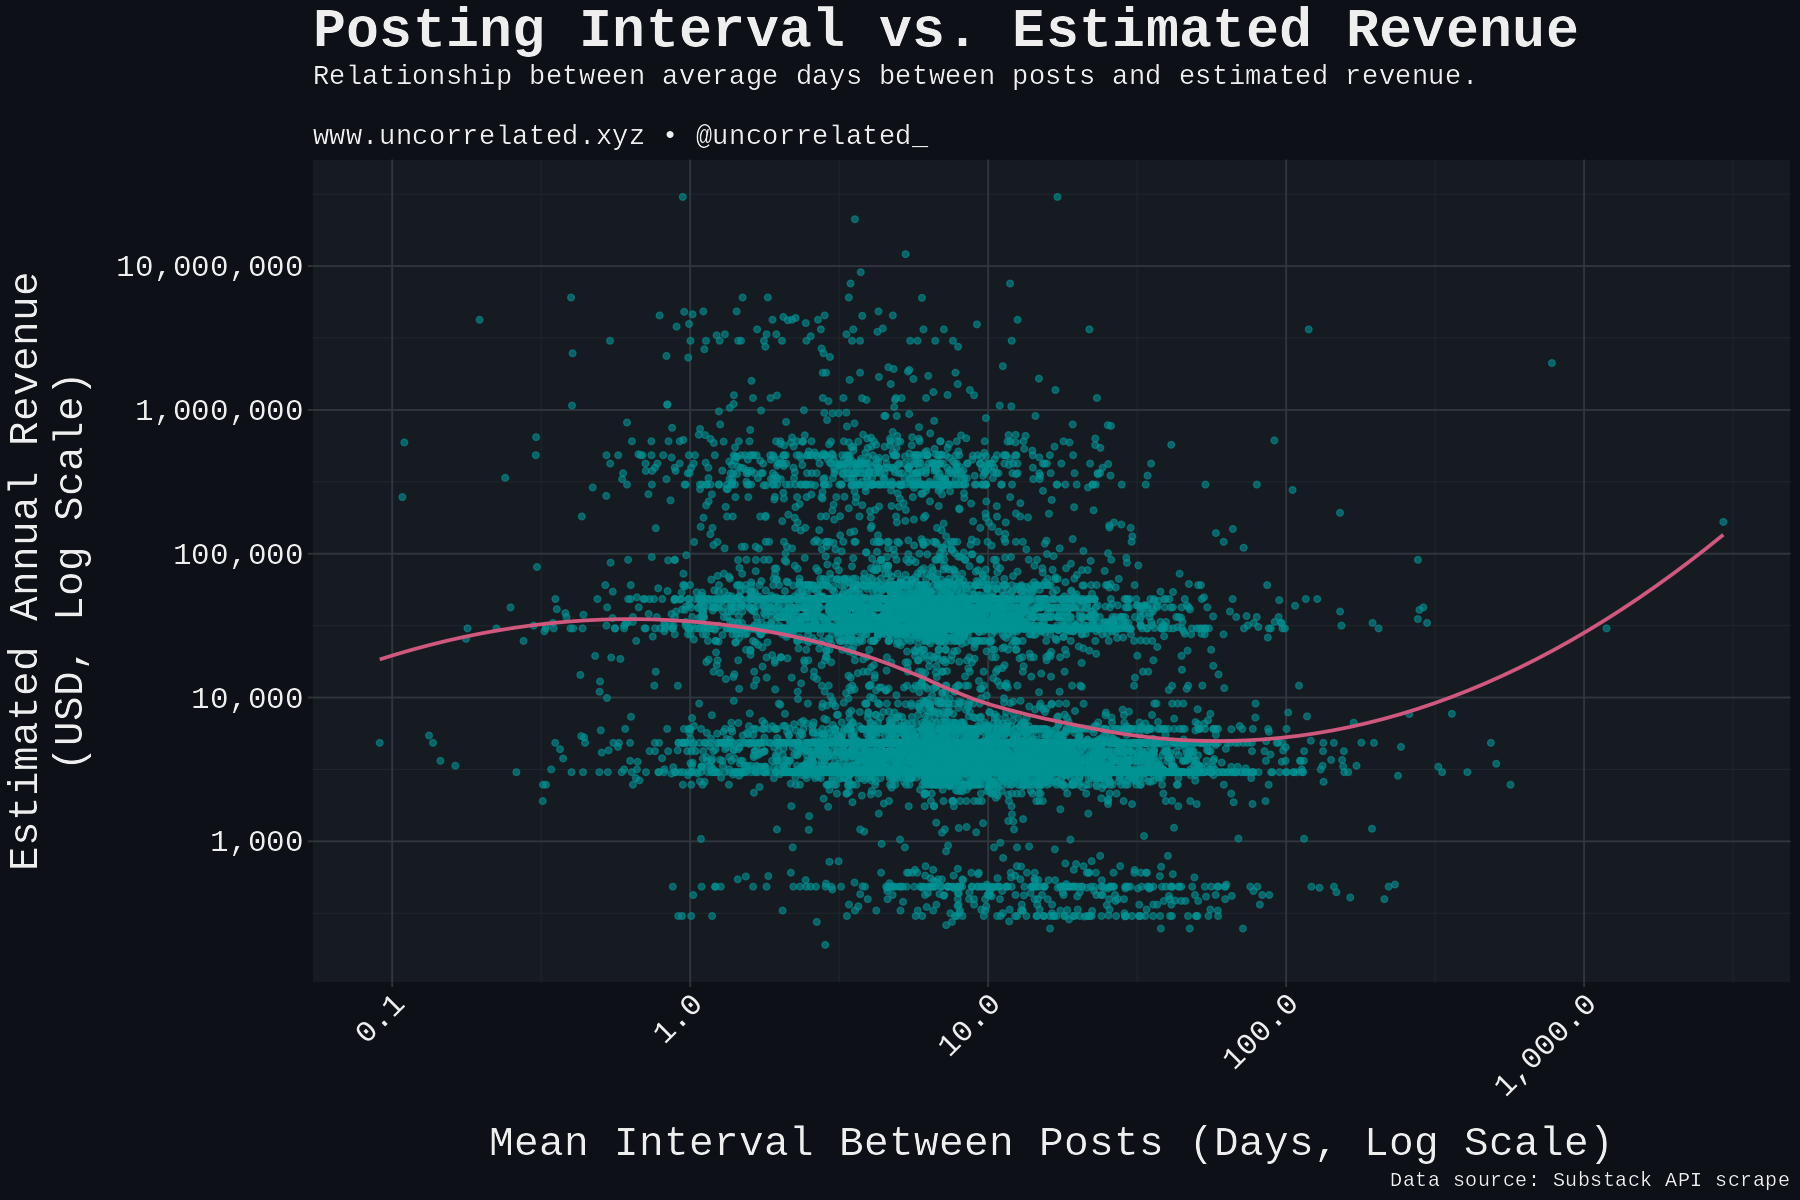
| Mean Interval (log) | -0.301 | 0.0188 | -16.0 | < 0.001 *** | Posting more frequently = Higher revenue |
| Variance Interval (log) | 0.0160 | 0.00612 | 2.62 | 0.009 ** | Slightly less consistent posting = Higher revenue? |
| Percent Paid Posts | 0.355 | 0.0240 | 14.8 | < 0.001 *** | More paid posts = Higher revenue (up to a point) |
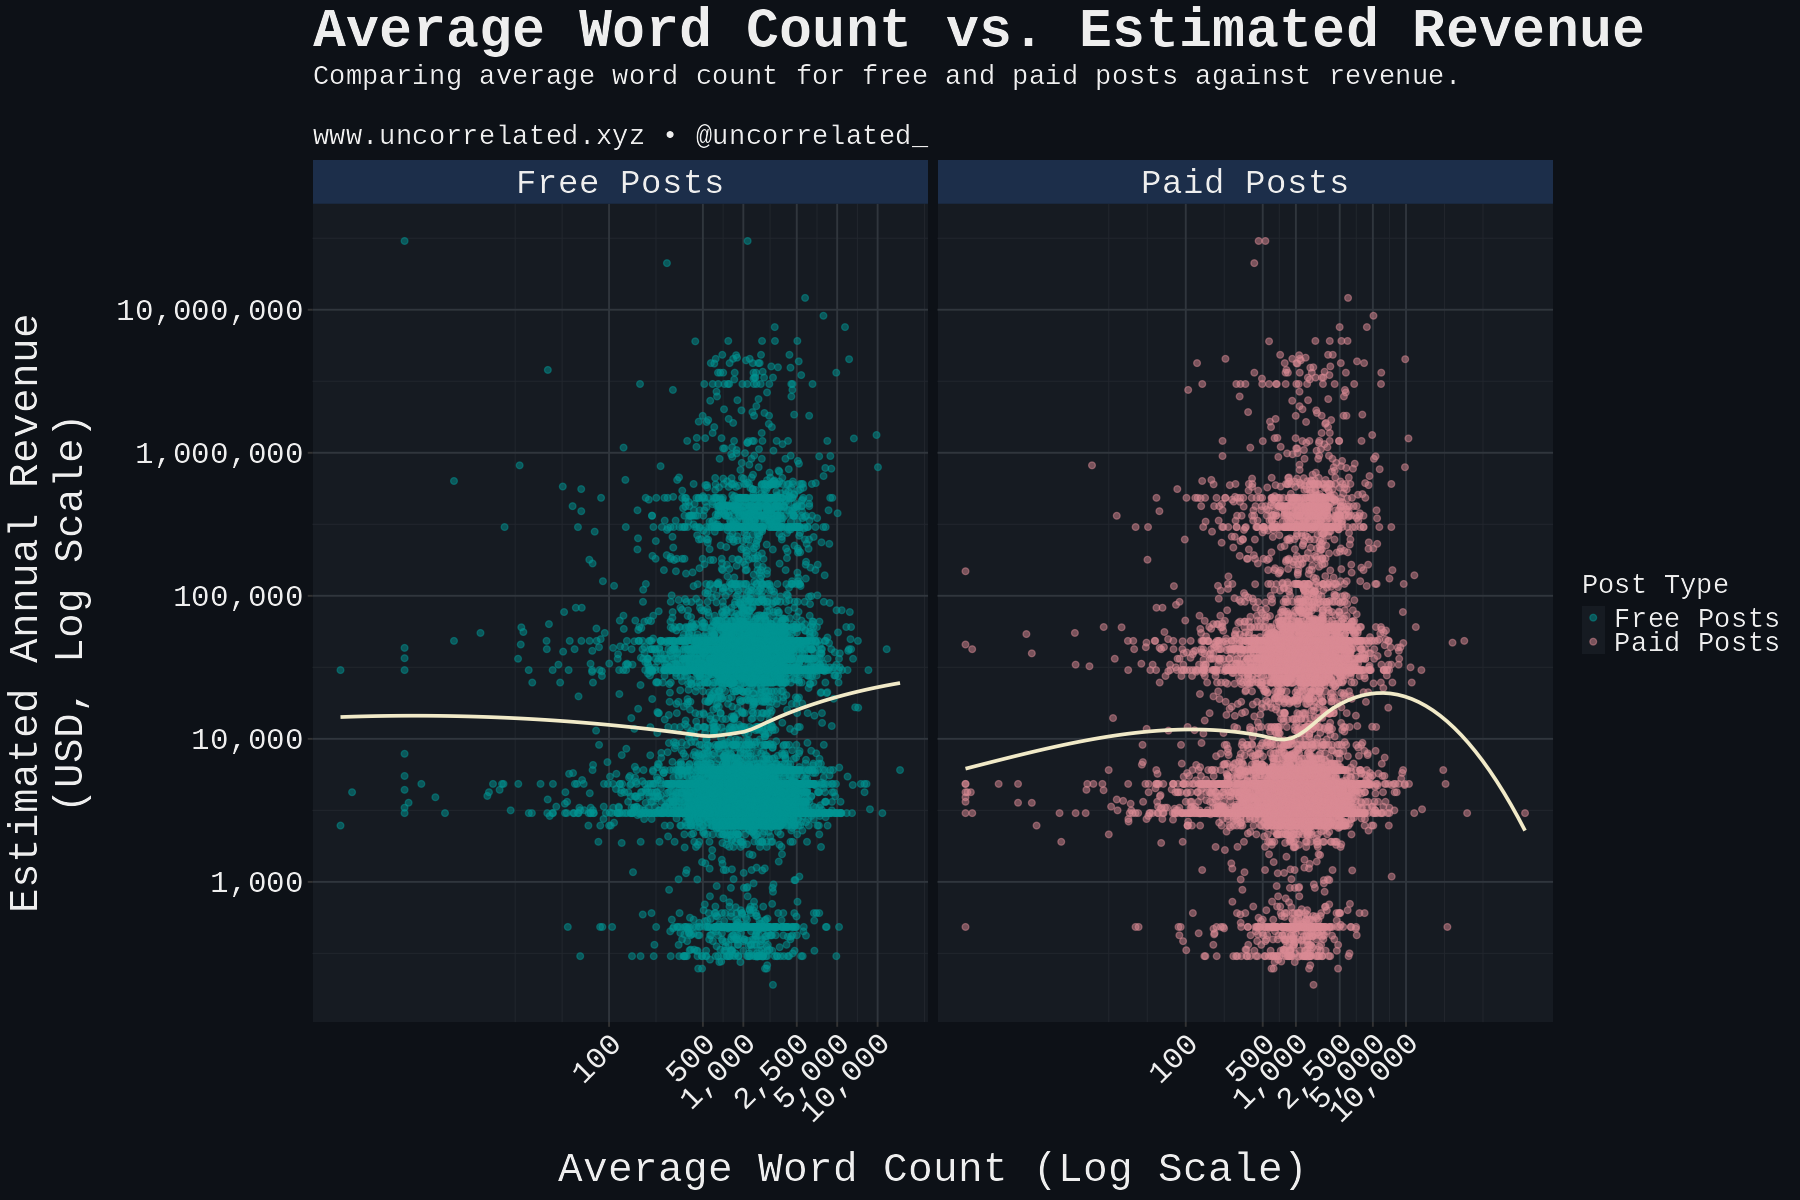
| Avg Wordcount Free (log) | 0.0791 | 0.0148 | 5.34 | < 0.001 *** | Longer free posts = Slightly higher revenue |
| Avg Wordcount Paid (log) | 0.0540 | 0.0130 | 4.16 | < 0.001 *** | Longer paid posts = Slightly higher revenue |
| Avg Description Length | 0.0394 | 0.0170 | 2.32 | 0.020 * | Longer descriptions = Slightly higher revenue |
(Significance codes: 0 ‘***’ 0.001 ‘**’ 0.01 ‘*’ 0.05 ‘.’ 0.1 ’ ’ 1. Estimates represent change in standardized log-revenue for a one-unit change in the predictor. Categories compared relative to Arts & Entertainment baseline in the full model)
Key Takeaways for Substacks:
- Charge More: Price remains a powerful lever. However, it should be noted that by default estimated revenue is a function of price. So this correlation may exist regardless.
- Post Often: Reducing the average time between posts (posting more frequently) still shows a strong positive association with revenue.
- Paid Percentage: The positive correlation holds – more paid posts generally link to higher revenue in the model, though the visual plots (below) still suggest a potential curve peaking around 50-60%.
- Word Count: Longer posts (both free and paid, after log transformations) still show a statistically significant positive correlation with revenue, but the effect sizes are smaller than before. Frequency likely remains more impactful than length alone.
- Consistency? Maybe Not: The slight positive correlation for more variance in posting intervals persists. Frequency seems to matter more than rigid timing.
Category Matters Too:
When we included categories in the model, the relative revenue potential (compared to the Arts & Entertainment baseline) showed this pattern:
| Category | Revenue Effect (Estimate) | P-value |
|---|---|---|
| Culture | 1.01 | < 0.001 *** |
| U.S. Politics | 1.01 | < 0.001 *** |
| Finance | 0.52 | < 0.001 *** |
| Food & Drink | 0.48 | < 0.001 *** |
| Health Politics | 0.47 | < 0.001 *** |
| Health & Wellness | 0.33 | < 0.001 *** |
| Literature | 0.33 | < 0.001 *** |
| News | 0.25 | < 0.001 *** |
| World Politics | 0.25 | < 0.001 *** |
| Faith & Spirituality | 0.22 | < 0.001 *** |
| Technology | 0.20 | < 0.001 *** |
| Fashion & Beauty | 0.16 | 0.006 ** |
| Sports | 0.14 | 0.014 * |
| Business | 0.14 | 0.021 * |
| Comics | 0.05 | 0.669 |
| Science | 0.03 | 0.636 |
| Parenting | 0.01 | 0.860 |
| International | 0.01 | 0.908 |
| Humor | 0.00 | 0.990 |
| Climate & Environment | -0.06 | 0.353 |
| History | -0.09 | 0.153 |
| Crypto | -0.09 | 0.307 |
| Education | -0.10 | 0.091 . |
| Design | -0.10 | 0.171 |
| Music | -0.12 | 0.034 * |
| Travel | -0.13 | 0.035 * |
| Philosophy | -0.20 | < 0.001 *** |
| Fiction | -0.37 | < 0.001 *** |
(Significance codes: 0 ‘***’ 0.001 ‘**’ 0.01 ‘*’ 0.05 ‘.’ 0.1 ’ ’ 1)
Culture and US Politics remain top categories for revenue potential in this model, while Fiction and Philosophy show significantly lower potential.
Visualizing the Trends:
The visual patterns remain largely the same:
Posting Interval vs. Revenue: Shorter intervals trend higher.
Average Price vs. Revenue: Strong positive correlation.
Substack Age vs. Revenue: Older Substacks tend slightly higher.
Percent Paid Posts vs. Revenue: Linear trend up, but smoothed curve suggests a peak.
Word Count vs. Revenue: Positive trend, now reflecting the corrected word count scale.
Top Earning Substacks (Based on Estimates):
| Base URL | Free Subscribers | Est. Paid Subscribers | Avg Monthly Price (USD) | Estimated Avg Revenue (USD) |
|---|---|---|---|---|
https://nextplayinvesting.substack.com |
1,400 | Thousands | $458.33 | $30,250,000 |
https://heathercoxrichardson.substack.com |
2,400,000 | Hundreds of thousands | $4.58 | $30,250,000 |
https://www.topdowncharts.pro |
5,600 | Thousands | $320.83 | $21,175,000 |
https://www.lennysnewsletter.com |
1,000,000 | Tens of thousands | $18.33 | $12,100,000 |
https://newsletter.pragmaticengineer.com |
980,000 | Tens of thousands | $13.75 | $9,075,000 |
https://www.citriniresearch.com |
40,000 | Thousands | $114.58 | $7,562,500 |
https://www.natesilver.net |
290,000 | Tens of thousands | $11.46 | $7,562,500 |
https://www.noahpinion.blog |
365,000 | Tens of thousands | $9.17 | $6,050,000 |
https://www.thebulwark.com |
766,000 | Tens of thousands | $9.17 | $6,050,000 |
https://www.meidasplus.com |
561,000 | Tens of thousands | $9.17 | $6,050,000 |
(Note: Revenue is estimated based on Substack’s tiers and average pricing; actual figures may vary. Paid subscriber estimates are based on order of magnitude.)
Predicting Post Popularity (Likes)
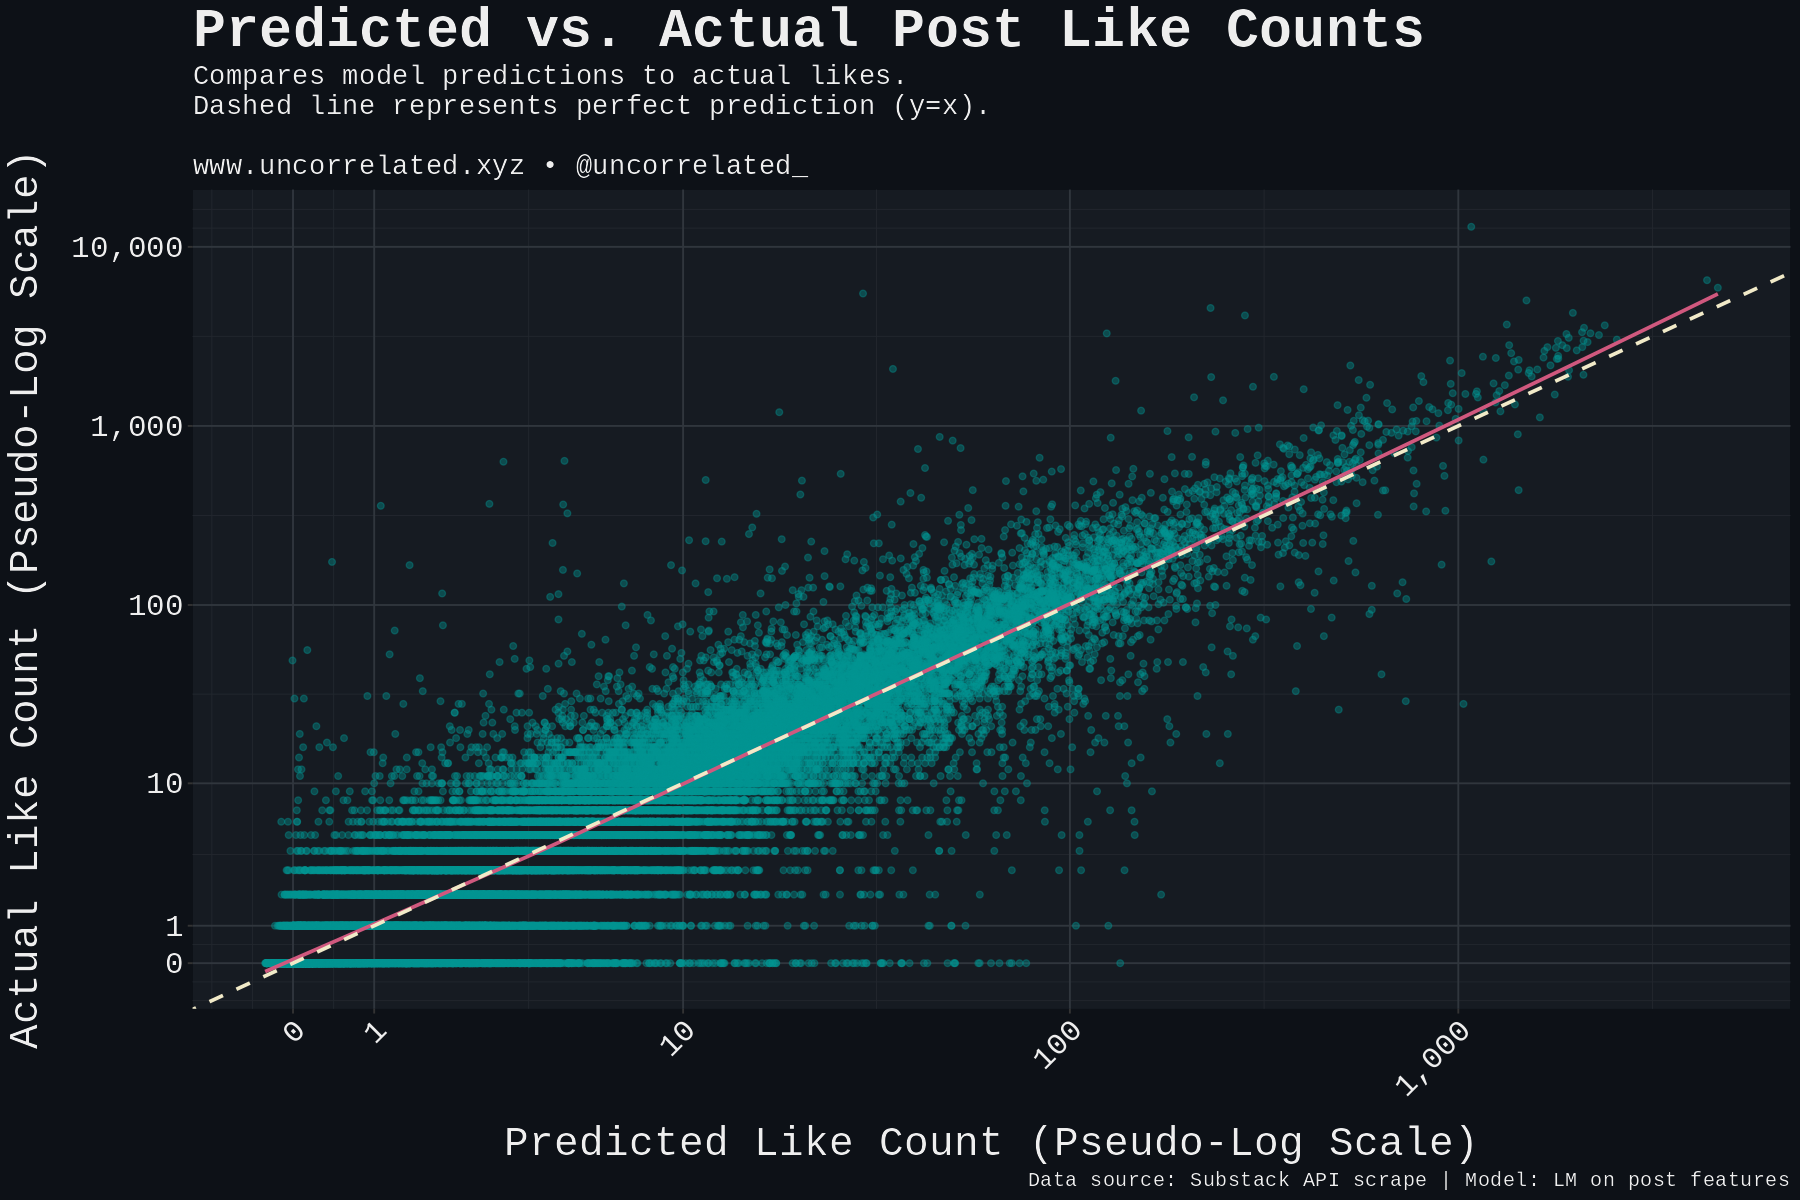
Our second model looked at factors predicting the number of likes (log-transformed) a post receives. This model was incredibly predictive (R-squared: 0.859)!
| Factor | Estimate (Effect Size) | Std. Error | Statistic | P-value | Interpretation |
|---|---|---|---|---|---|
| (Intercept) | -0.258 | 0.00372 | -69.3 | < 0.001 *** | Baseline likes |
| Word Count (log) | 0.0571 | 0.000341 | 168. | < 0.001 *** | Longer posts get slightly more likes |
| Description Length (log) | -0.00373 | 0.000448 | -8.33 | < 0.001 *** | Slightly shorter descriptions get more likes? |
| Is Paid = TRUE | -0.112 | 0.000863 | -130. | < 0.001 *** | Paid posts get significantly fewer likes |
| MA 10 Posts (log) | 0.939 | 0.000289 | 3248. | < 0.001 *** | MASSIVE effect: Past likes predict future likes |
| Is First Post = TRUE | 1.64 | 0.00607 | 269. | < 0.001 *** | HUGE boost for the very first post |
(Note: Categories also included, showing varied effects relative to Arts baseline. Comics +0.15, Health Politics +0.06, Business -0.09, US Politics -0.06)
Key Takeaways for Posts:
- Momentum is Everything: The single biggest predictor by far is the moving average of likes on the previous 10 posts (
MA_10_posts). Success breeds success. If your recent posts did well, your next one likely will too. This explains ~86% of the variance alone! - Nail Your First Post: The
first_postTRUEcoefficient is enormous. Your very first post gets a massive visibility boost (algorithmic or otherwise). Don’t waste it! - Paid Wall Hurts Likes: Unsurprisingly, putting a post behind a paywall significantly reduces its like count. This is the trade-off for monetization.
- Length & Description: Longer posts get slightly more likes, while posts with slightly shorter descriptions do better. Keep the summary punchy?
- Category Effects: Comics and Health Politics posts tend to get more likes than average, while categories like Business, US Politics, and Technology get fewer, holding other factors constant.
Visualizing Post Popularity:
Moving Average vs. Actual Likes: The relationship is incredibly tight. Past performance is the best predictor of future performance.
Model Predictions vs. Actual Likes: Our model tracks actual likes very well, especially given the dominance of the moving average predictor.
Most Liked Posts (Raw Counts):
| Canonical URL | Like Count |
|---|---|
https://heathercoxrichardson.substack.com/p/september-11-2022 |
37335 |
https://anntelnaes.substack.com/p/why-im-quitting-the-washington-post |
23207 |
https://ayushithakkar.substack.com/p/low-energy-habits-that-improved-my |
22231 |
https://robertreich.substack.com/p/trump-will-overplay-his-hand-be-ready |
22140 |
https://catherineshannon.substack.com/p/your-phone-is-why-you-dont-feel-sexy |
20620 |
https://steady.substack.com/p/heartbreak-for-cbs-news |
20327 |
https://www.fascism.link/p/why-holocaust-survivors-compare-trump-to-hitler |
20202 |
https://harrylitman.substack.com/p/why-i-just-resigned-from-the-los |
19448 |
https://contrarian.substack.com/p/i-have-resigned-from-the-washington |
18974 |
https://tellthebeees.substack.com/p/the-mainstreaming-of-loserdom |
16308 |
Best Performing Posts (Relative to Model):
| Canonical URL | Model Residuals (Higher = Better than Expected) |
|---|---|
https://bysarahnoack.substack.com/p/dump-your-matcha-and-have-a-cigarette |
6.75 |
https://michaeldsellers.substack.com/p/a-deeper-look-at-claims-by-kgb-officer |
6.74 |
https://www.pennymarie.nz/p/breaking-news-bill-gates-loses-lawsuit |
6.63 |
https://thisiswhatawitchthinksabout.substack.com/p/things-got-really-weird-when-i-got |
6.49 |
https://johnbirdsall.substack.com/p/anthony-bourdain-and-queer-shame |
6.47 |
https://www.nonzero.org/p/a-war-bigger-than-mindful-resistance |
6.41 |
https://sagejustice.substack.com/p/mel-robbins-and-plagiarism |
6.02 |
https://alisav.substack.com/p/the-post-trump-populist-revolution |
6.01 |
https://www.jacobsilverman.com/p/we-got-a-judge-to-unseal-a-list-of |
5.99 |
https://drlauriemarbas.substack.com/p/im-54-if-youre-a-woman-in-your-30s |
5.93 |
These might represent posts with particularly viral topics, exceptional writing, or perhaps successful off-platform promotion.
Conclusion: Key Strategies for Substack Growth
Synthesizing the updated model results and observations:
- Post Frequently: Still appears highly beneficial for revenue. Volume likely trumps perfectionism.
- Build Momentum: Crucial for post visibility, given the massive impact of past likes.
- Optimize Your First Post: Leverage that initial algorithmic (?) boost.
- Price Strategically: Higher prices strongly correlate with higher revenue potential. Note the huge price difference between
nextplayinvestingandheathercoxrichardsondespite similar estimated revenue tiers – audience size and willingness to pay interact complexly. - Balance Free vs. Paid: The ~50% paid post mark still looks like a reasonable target based on visual inspection of the plots, despite the linear model showing a positive coefficient overall.
- Consider Your Category: Significant differences in revenue potential exist between categories.
- Word Count Matters (a little): Longer posts have a small, positive association with revenue, but don’t sacrifice frequency for extreme length.
Ultimately, data provides patterns, not guarantees. Quality content and audience connection are paramount. However, understanding these underlying dynamics can help you make more informed decisions as you navigate the Substack landscape. Good luck!
Disclaimer: This analysis is based on publicly available data and statistical modeling. Revenue figures are estimates based on Substack’s tiers and may not reflect actual earnings.
Machine-Learning