How Genetic is Lifelong Inceldom?
The quantitative genetic and molecular landscape of lifelong sexlessness.
TL;DR
-
Lifelong sexlessness at age 30 sits at roughly 2% in women and 4% in men in the US data; by age 40 it is about 1% in both sexes.
-
Genes play a moderate role, not an overwhelming one. If you're a 30-year-old male virgin, your identical twin has about a 1-in-5 chance of also being a virgin; for women the figure is closer to 1-in-7. In odds terms, having a sexless identical twin increases your odds by 6x if male and 10x if female.
-
At the top 0.1% of combined genetic predisposition, the chance of male age-40 sexlessness is about 38%, roughly the schizophrenia-twin benchmark.
-
Between men and women the genes for sexlessness are partly different.
-
Common genetic variants, not rare devastating "truecel" genes, account for the vast majority of sexlessness.
-
Sexless persons phenotypically (their behaviour, traits, etc.) present more like extreme childlessness than autism.
-
The bigger driver of the rising sexless tail is the modern mating environment, not the gene pool. The same genes in a different culture would produce a different outcome.

The claim, and the benchmark
The blackpill claim is that lifelong male virginity is a genetically overwhelming phenotype: a slice of the population locked out of partnered sex by their DNA.
One natural calibration point for a stereotypically genetic illness is schizophrenia. Schizophrenia has roughly 1% lifetime prevalence and ~80% heritability (Sullivan et al., 2003). However, you may be surprised to read that it only has ~40% twin concordance.1 Twin concordance, throughout this post, is the probability your identical (monozygotic, "MZ") twin has the trait given that you do; for schizophrenia, when one MZ twin has it, the other has it nearly half the time.
So this is to say, despite being very hereditary, where one twin has schizophrenia, there's only a 40% chance the other does too. This is the benchmark: if sexlessness is genetically overwhelming in the same sense, it should get somewhere near that level.
The question is whether lifelong sexlessness sits in that same regime, or whether the determinist framing is overselling the genetics.
The arithmetic to calculate concordance takes three inputs: a heritability for lifelong sexlessness, an age-specific prevalence, and a model that maps the two onto expected twin concordance.
The model is Falconer's 1965 liability-threshold extension of the breeder's equation (Falconer, 1965). Using his model, on schizophrenia with a h² of 0.80 and P = 1%, the estimated concordance is 38%, which is remarkably similar to the 40% above.
How does such a formula work so well? It's based on regression towards the mean. Tracing the formula's lineage runs back to Galton's 1886 height regression (Galton, 1886), the original observation of regression-towards-the-mean that heritability now formalises.2
The intuition is short. Treat any trait as the sum of two pieces: genetics (the heritable part) and environment (everything else). Galton worked on height, so we'll use height.
An identical (MZ) twin shares your genetics exactly. The environmental component, by definition, doesn't carry across: the twin lives a different life and draws fresh exposures.
The breeder's equation, formalised by Lush half a century after Galton's observation (Lush, 1937), makes the bookkeeping precise. For MZ twins, who share genes exactly, the expected deviation of one from the population mean is h² times the deviation of the other:
Worked example. The average US adult male is 5'9" (69 inches), with a standard deviation of about 3 inches; height is highly heritable, h² ≈ 0.8. Take a man who is 6'3", and walk it through.
Convert to inches:
His deviation from the population mean:
Apply the breeder's equation to get the expected deviation of his MZ twin:
Add the expected deviation back to the population mean to get the twin's predicted height:
Convert back to feet and inches:
The twin regresses about 1.2 inches back toward the population mean. That 1.2 inches was the lucky environmental boost the 6'3" man got, which doesn't carry across; the 4.8 inches that does is the genetic share. At h² = 1 the regression vanishes and the twin matches; at h² = 0 the regression is total and the twin lands at the population mean regardless. Heritability is the slope.
That direct h² slope between MZ twins (no halving, as you'd see for parent-to-child since each parent contributes only half their genes) is what twin concordance comes out of.
As mentioned, Galton saw this 140 years ago. He measured the adult heights of nearly a thousand children against the average of their parents' heights, plotted one against the other, and found a line tilted shallower than 1-to-1. The children of very tall parents came in tall but not as tall as their parents; the children of very short parents came in short but not as short.
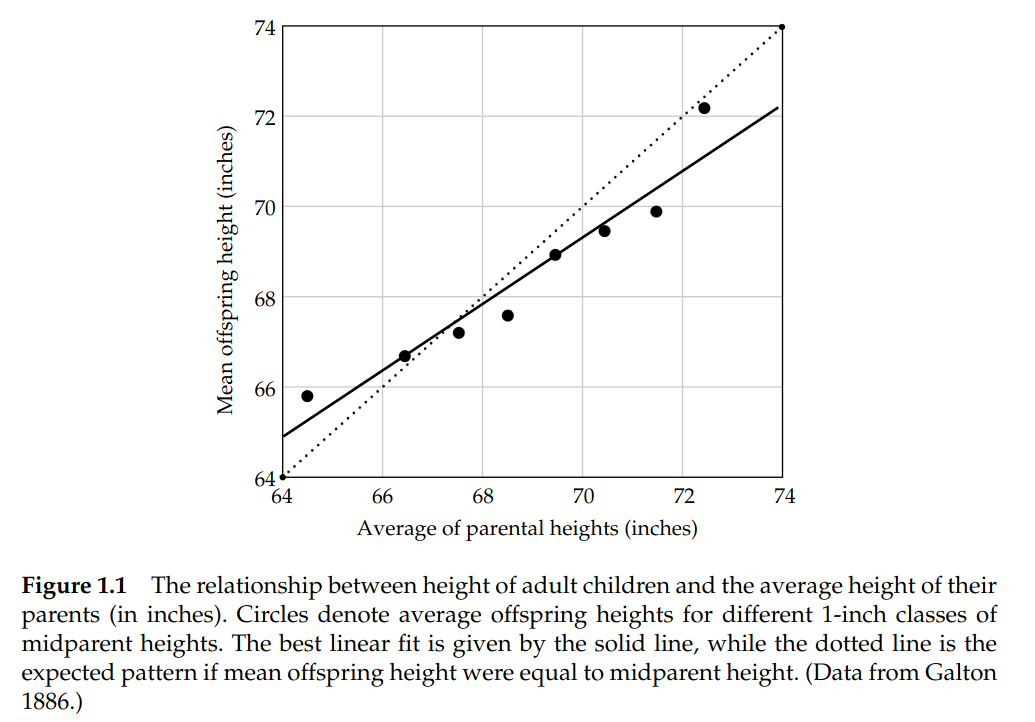 Figure 1. Adult-offspring mean height plotted against mid-parent height (Galton, 1886); the original observation of regression toward the mean and the visual intuition behind the breeder's equation.
So bringing it back: the calculation asks how often lifelong sexlessness should repeat in an identical twin. If genes really sealed the outcome, this number should be very high. It is not.
What we're estimating
Three related things get blurred together in this topic: sexlessness, lifelong virginity, and inceldom. They are not identical.
The measured phenotype in Abdellaoui et al. (Abdellaoui et al., 2025) is sexlessness: people who report never having had vaginal, oral, or anal intercourse. The NSFG (National Survey of Family Growth), using the public 2011–2023 any-sex history variables, gets close to the same phenotype: no reported vaginal, oral, or anal sex with either sex.
Neither maps onto "incel identity," which is narrower, self-conscious, mostly male, culturally loaded, and not recorded in the surveys. When this post uses "incel" loosely, read it as lifelong sexlessness phenotype, not the literal forum or culturally ascribed identity.
For our post, the age cut matters as prevalence is directly used to compute concordance. At 20, this is mostly delayed debut. By 30 and especially 40 it is much closer to lifelong. The NSFG, pooled across waves 2011–2023, supplies the prevalence we need.3 The pooled sample is ~52,000 respondents, ages 15–49, weighted to nationally representative.
| Age | Female | Female 95% CI | Male | Male 95% CI |
|---|---|---|---|---|
| 20 | 14.5% | 11.1–18.7% | 22.1% | 17.8–27.1% |
| 25 | 4.4% | 2.9–6.7% | 8.2% | 5.7–11.6% |
| 30 | 1.7% | 0.9–3.3% | 3.8% | 2.3–6.3% |
| 35 | 0.5% | 0.2–1.8% | 1.4% | 0.6–3.2% |
| 40 | 1.1% | 0.4–2.9% | 0.9% | 0.3–2.7% |
| 44 | 0.5% | 0.1–1.9% | 0.8% | 0.3–2.7% |
Table 2. Age-specific lifelong-sexlessness prevalence in the NSFG pooled 2011–2023 sample, by sex; 95% CIs are approximate weighted Wilson intervals using Kish effective N.
The main male excess is around age 30. By 40 the point estimates are roughly equal, but the CIs are wide enough that the exact sex gap is not worth over-reading.
The genetic landscape of lifelong sexlessness
The literature on the heritability of lifelong sexlessness almost does not exist.4 No twin study has ever directly measured it; the low-single-digit tail past age 30 is too small to isolate cleanly without access to the largest registries, which are generally restricted.
The defensible move therefore is to estimate heritability via proxy traits: childlessness, age at first sex, loneliness, ever-married status, and so on. The table below condenses a number of heritability estimates from various sexlessness-adjacent sex-and-relationship phenotype papers.
| Trait | Design / sample | h² (best model) | Anchor |
|---|---|---|---|
| Completed childlessness (≥45F, ≥50M) | Swedish Twin Registry, AE, sexes equal | 0.47 (0.37–0.58) | (Verweij et al., 2017) |
| Completed fertility (F, MIDUS) | ACE | 0.28 | (Briley et al., 2017) |
| Completed fertility (F, TwinsUK) | ACE | 0.47 | (Briley et al., 2017) |
| Completed fertility (F) | Swedish Twin Registry | 0.24 | (Zietsch et al., 2014) |
| Age at first birth (F) | TwinsUK | 0.26–0.35 | (Tropf et al., 2015) |
| Age at first sex (M) | Finnish Twin Cohort | 0.61 (0.54–0.68) | (Mustanski et al., 2007) |
| Age at first sex (F) | Finnish Twin Cohort | 0.54 (0.36–0.71) | (Mustanski et al., 2007) |
| Age at first sex (pooled) | 6 large studies | 0.23–0.72 | (Dunne et al., 1997); (Rodgers et al., 1999); (Waldron et al., 2007); (Harden, 2014) |
| Loneliness (adult) | Netherlands Twin Registry | 0.48 (0.44–0.53) | (Boomsma et al., 2005) |
| Ever-married (pre-1960 US) | Minnesota Twin Registry | 0.70 (base-rate artefact) | (Johnson et al., 2004) |
| Divorce | Multiple | ~0.50 (0.36–0.65) | (McGue & Lykken, 1992); (Jocklin et al., 1996) |
Table 3. Twin-study heritability estimates for sex-and-relationship phenotypes adjacent to lifelong sexlessness.
The cluster sits between 0.20 and 0.50, with the two highest sex-timing estimates pushing toward 0.60.5 Nothing reaches schizophrenia's 0.80, autism's similar territory, or height's ~0.80. Moderate, not overwhelming.
Twin studies decompose a trait's variance into three buckets: additive genes (A), shared-family environment (C), and everything else / unique environment (E). The A bucket should not be read as direct DNA-to-outcome causation only: it can also include gene-environment correlation, where heritable traits lead people to select, evoke, or remain in different environments. C is the part of family environment that makes co-twins similar over and above their genetic similarity.
In these studies, shared environment is often not the main signal for adult relationship and fertility traits. It is mostly absent from completed childlessness, loneliness, ever-married status, and divorce. Fertility timing and some age-at-first-sex subgroups retain small-to-moderate shared-environment components. As we show next, genes for childlessness overlap with sexlessness the most. So overall, h² is mostly reflecting inherited liability rather than common upbringing, but it is not a clean DNA-only fate meter.6
The sexlessness manifold: genetic and phenotypic
Abdellaoui, Verweij, Nivard, Mills and colleagues (Abdellaoui et al., 2025) published a GWAS of lifelong sexlessness in PNAS in 2025, on 405,117 UK Biobank participants of European descent. 3,929 of them, about 1%, reported never having had vaginal, oral, or anal intercourse. Two of the paper's analyses can be read side by side. The first is a panel of genetic correlations (r_g) between sexlessness and 82 reference traits.7 The second measures the phenotypic associations between sexlessness and a matched set of life-circumstance variables (smoking, education, mood, social contact, and so on) in the same respondents. Where the two share a trait, lining them up tests whether the DNA-level profile and the lived profile of sexlessness have the same shape; Table 4 below does exactly that.
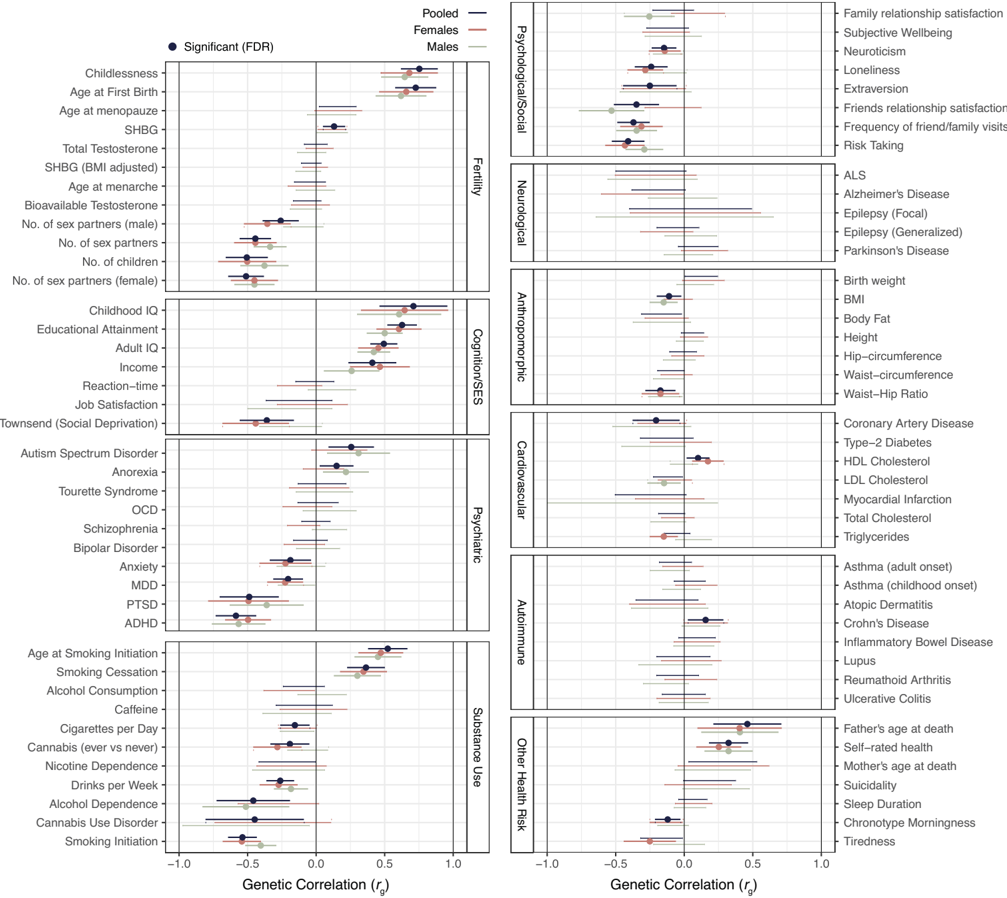 Figure 2. Genetic correlations between lifelong sexlessness and a panel of complex traits, in pooled, male, and female samples; from Abdellaoui et al. (Abdellaoui et al., 2025), Fig. 3, PNAS, CC-BY.
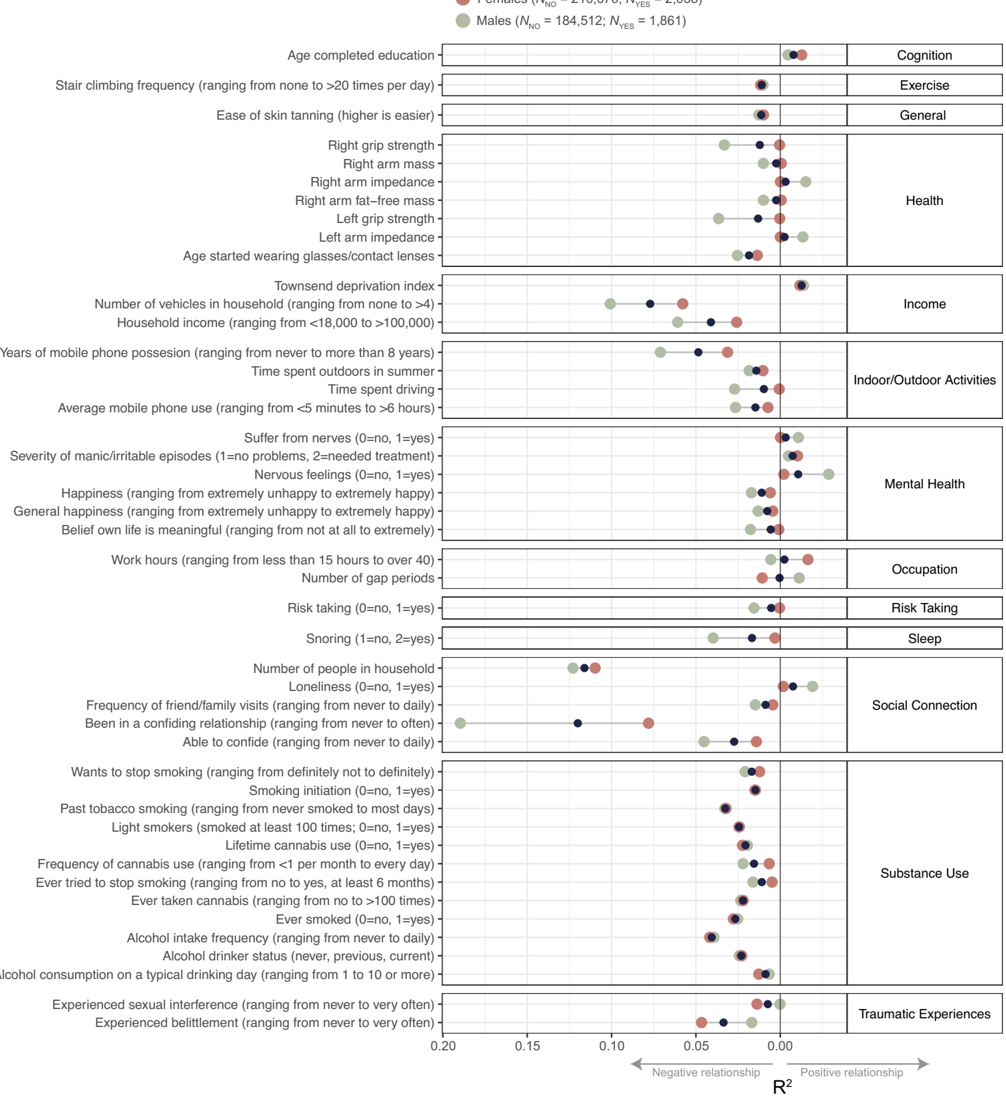 Figure 3. Phenotypic associations between lifelong sexlessness and the same trait panel, in pooled, male, and female samples; from Abdellaoui et al. (Abdellaoui et al., 2025), PNAS, CC-BY.
| Axis | Trait | r_g | ΔR² | β | Same direction? |
|---|---|---|---|---|---|
| Fertility | Childlessness | +0.75 | – | – | – |
| Fertility | Age at first sex / first birth (M) | +0.73 | 2.7% (M) | +0.10 | Same |
| Cognitive | Childhood IQ | +0.71 | – | – | – |
| Cognitive | Educational attainment | +0.63 | 0.79% | +0.26 | Same |
| Externalising | ADHD | −0.59 | – | – | – |
| Externalising | Smoking initiation | −0.54 | 1.47% | −1.56 | Same |
| Partner-acquisition | Autism spectrum disorder (M) | +0.31 | – | – | – |
| Partner-acquisition | Autism spectrum disorder (F) | +0.17 n.s. | – | – | – |
| Mental health | Major depression / happiness | ~0 | 1.10% | +0.48 | Pheno only |
| Mental health | Anxiety / nervous feelings | ~0 | 1.06% | +0.75 | Pheno only |
Table 4. Genetic correlation (r_g, LDSC) and phenotypic association (ΔR², β) between lifelong sexlessness and selected trait clusters in Abdellaoui et al. (Abdellaoui et al., 2025), with sign-agreement between the genetic and phenotypic columns.
All values from the supplementary tables of Abdellaoui et al.; pooled-sex unless labelled. The r_g column asks whether the same genes drive sexlessness and the named trait; the phenotypic columns ask whether the trait actually predicts sexlessness in the same respondents. A dash means the trait sits in an external GWAS only, with no paired phenotypic estimate. Pheno only means near-zero genetic overlap but a real lived-experience association.
The DNA-level profile reads as careful student: high on cognition and delayed gratification, low on externalising and impulsivity. Sebastian Jensen, reading the same column of correlations, puts it bluntly:
Phenotypically, not having sex seems to correlate with lower social standing or a lack of social capital; genetically, it seems to be more downstream of neurotype than any actual pathology.
Faced with a marginal romantic option, he adds, some personality types are simply "more likely to default to no than yes". The phenotypic side of the Abdellaoui data agrees on the cognitive-substance axis: sexless respondents smoke less, drink less, take fewer drugs, and complete more education. They diverge on one cluster. Depression, anxiety, and neuroticism are essentially uncorrelated with sexlessness genetically, but sexless respondents really are unhappier and more anxious than the average UK Biobank participant. The disagreement is informative, not noise: the misery looks downstream of the situation rather than a shared genetic root.8
The within-paper comparison points hard at one anchor proxy. Abdellaoui et al. run the same analysis for completed childlessness, with the sexless respondents removed from the childlessness sample, against the same trait list. Pooled sexlessness-childlessness r_g is +0.75. Take the row of 81 r_g values for sexlessness (its DNA-level overlap with each of childlessness, schizophrenia, IQ, ADHD, and so on) and the same row for childlessness, and the two rows agree trait-by-trait, sign and magnitude, at Pearson r = 0.838. Sexlessness and childlessness leave essentially the same genetic fingerprint across the trait inventory. Phenotypically, childlessness loads on the same axes (occupation, social connection, sexuality), with weaker but same-direction patterns for confiding relationships, friend and family contact, meaning, and loneliness. Childlessness reads as a broader, more socially acceptable version of the same partner-acquisition margin.
Completed childlessness is therefore the headline heritability proxy. Verweij et al. (Verweij et al., 2017) estimate it at h² = 0.47 (95% CI 0.37–0.58) in the Swedish Twin Registry; their best-fitting model constrains heritability equal across sexes and fixes the cross-sex genetic correlation at zero. That is the number propagated through the rest of the post.
Autism is the other candidate worth ruling out as the headline. The Abdellaoui ASD signal is real, especially in men: pooled r_g = 0.26, male r_g = 0.31, female r_g = 0.17 (not clearly significant). Readers arriving from the autism-and-incel essays are not imagining the connection. But the size and shape are wrong for calibration; ASD is one component of the sexless tail rather than the trait that shares its overall fingerprint. The rare-variant channel that LDSC misses gets its own treatment further down.
An r_g²-weighted triangulation across the five adjacent phenotypes with both an LDSC r_g and a published twin h² gives ~0.35 as a low-end cross-check; details in the supplementary.
External probability surveys replicate the phenotypic side outside UK Biobank.9
The calculation: MZ concordance for lifelong sexlessness by age
Both inputs are now in hand. The completed-childlessness anchor from the previous section gives the heritability, h² = 0.47. The NSFG pooled 2011–2023 sample supplies the age-and-sex-specific prevalences (Table 2): ~2% (F) and ~4% (M) at age 30, falling to about 1% by age 40, with much higher fractions in the early 20s where the phenotype is mostly delayed debut. Feed each (age, sex) cell through Falconer's liability-threshold model and read off the predicted MZ concordance.10
| Sex | Age | NSFG prev | h² = 0.20 | h² = 0.47 | h² = 0.60 |
|---|---|---|---|---|---|
| F | 20 | 14.5% | 22.5% | 36.1% | 44.3% |
| F | 25 | 4.4% | 9.6% | 21.4% | 29.8% |
| F | 30 | 1.7% | 5.0% | 14.5% | 22.3% |
| F | 40 | 1.1% | 3.7% | 12.0% | 19.4% |
| M | 20 | 22.1% | 30.6% | 43.9% | 51.4% |
| M | 25 | 8.2% | 14.9% | 28.0% | 36.5% |
| M | 30 | 3.8% | 8.7% | 20.2% | 28.5% |
| M | 40 | 0.9% | 3.0% | 10.8% | 17.9% |
Table 5. Predicted MZ-twin concordance for lifelong sexlessness by age and sex across a low anchor (h² = 0.20), the completed-childlessness proxy (h² = 0.47), and a generous upper bound (h² = 0.60); the bold age-30 male cell at the proxy heritability is the post's central numerical result.
The headline is modest: at the completed-childlessness proxy heritability and the empirical age-30 prevalence, the identical twin of a 30-year-old male virgin is roughly 20.2% likely to also be a virgin. That is still about 6x the same-age male baseline odds, but it is not deterministic. The female number at the same age is 14.5%, about 10x baseline odds. Even at h² = 0.60, the deliberately generous upper bound, age-30 male concordance reaches only 28.5%; schizophrenia at 38% predicted and 41–46% observed sits in a different regime.11
The continuous version of the same calculation lives below.
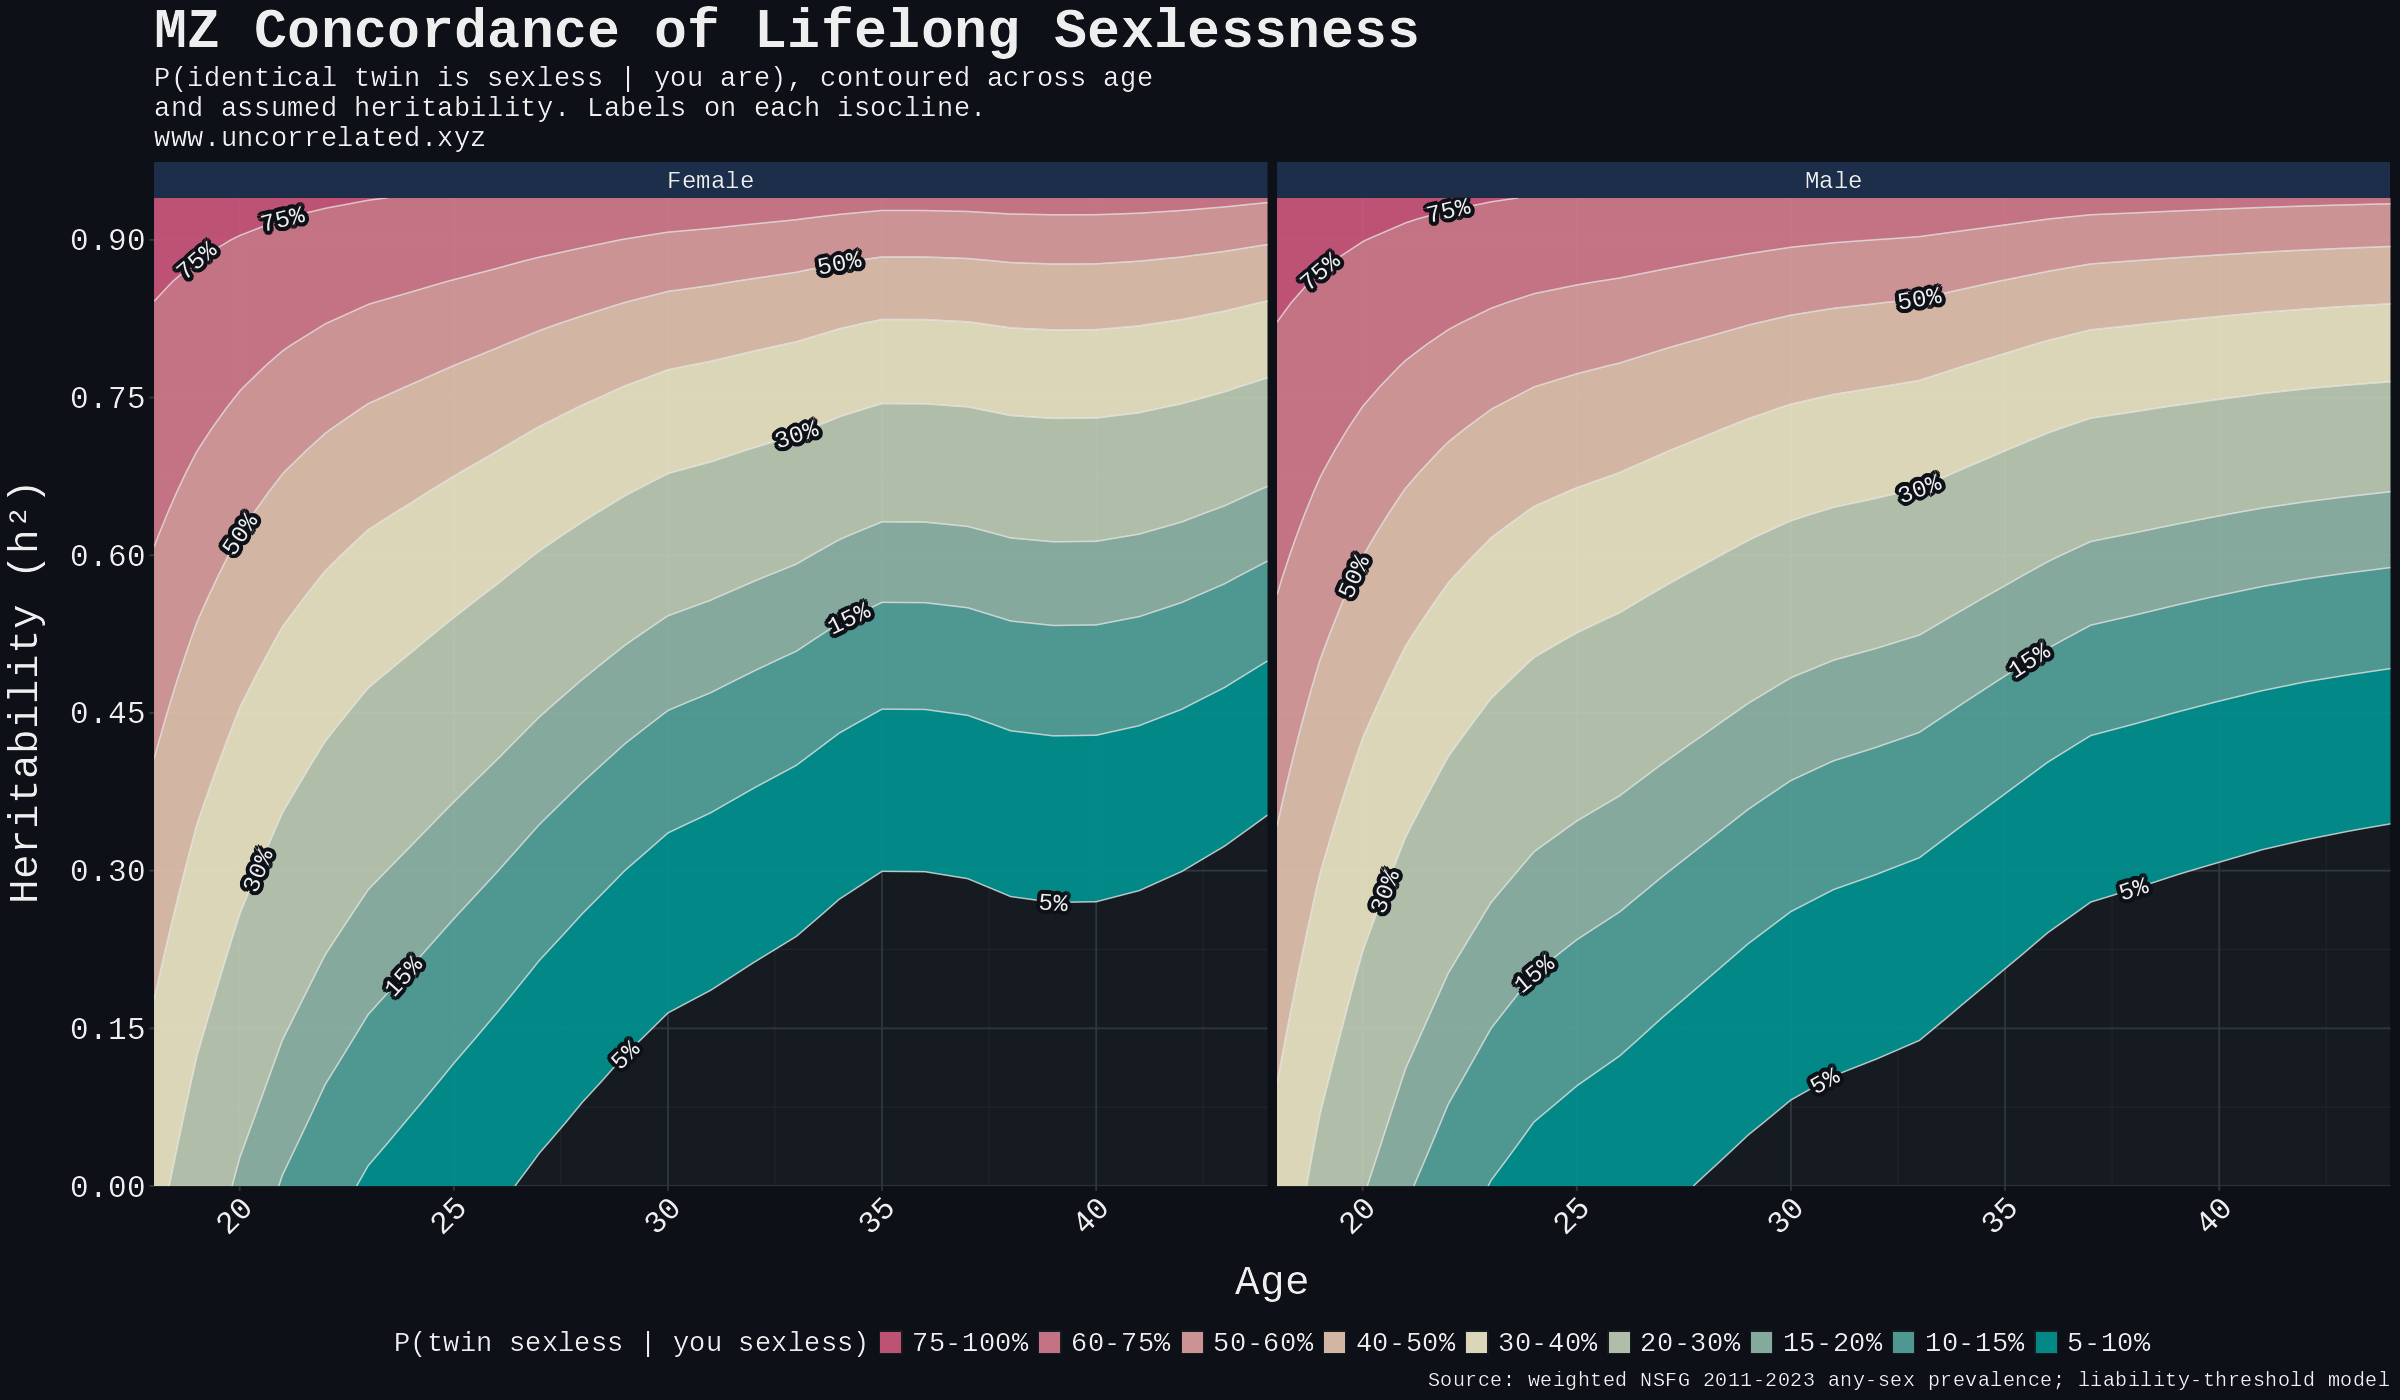 Figure 4. Predicted MZ-twin concordance for lifelong sexlessness contoured over the (age, h²) plane, female and male panels. Reading: pick any (age, h²) point and the colour band at that point is the predicted concordance.
The corrected prevalence pushes the post-30 estimates downward. The schizophrenia benchmark still appears on the plot, but for the actual lifelong tail it sits above the defensible h² range; the realistic band is more like 10–20% after age 30, not 40%. The pre-25 region runs hotter only because prevalence is much higher there, and the phenotype is mostly delayed sexual debut rather than lifelong sexlessness; the 36–44% concordance at age 20 does not say what the determinist framing wants it to say. The age-30 tail is where the lifelong reading actually lives.
Rare variants, autism, and the actual truecel
Sexlessness has two distinct genetic architectures, not one. The post so far has been about common-variant sexlessness: the polygenic cluster of cognitive, delayed-gratification, and low-externalising traits picked up by Table 4, with each variant nudging the phenotype by a fraction of a percent and the cumulative heritability landing around 0.47.
The other regime is rare-variant sexlessness: individually rare damaging variants such as protein-truncating variants in strongly constrained genes, copy-number variants, and de novo events. They contribute to autism at the severity end and to intellectual disability, so they are worth separating from the common-variant GWAS signal.
These rare variants are mostly invisible to the LDSC genetic correlations in Table 4, because LDSC measures common-variant overlap by construction. The modest r_g = 0.26 between autism and sexlessness in Table 4 is therefore only the common-variant slice of the autism overlap. But absence from LDSC does not imply a large rare-variant contribution to sexlessness overall: these rare variants are extremely rare. 12
Gardner, Neville, Samocha et al. (Gardner et al., 2022) measure this rare-variant regime directly. Whole-exome sequencing on a 139,477-participant subset of UK Biobank, with array-based copy-number-variant calls on a broader 340,925. Their measure is s_het burden: a per-individual weighted load of protein-truncating variants (broken copies of a gene) in genes under strong evolutionary constraint. The constrained gene set overlaps autism and intellectual-disability loci, so s_het burden is, informally, a measure of damaging rare-variant load in genes where selection most strongly dislikes disruption.
The effect is real, but small in the population.
Gardner's per-unit coefficient is large: each unit of s_het burden cuts the odds of ever having had sex by roughly 94% in men (OR = 0.06, 95% CI 0.03–0.14) and 89% in women (OR = 0.11, 95% CI 0.05–0.27). But one unit is not a typical observed burden. It is a slope parameter applied to a distribution where most people are at or near zero.
That scale correction matters more than the headline OR. In the reconstructed Gardner distribution, about 3.6% of people sit above s_het = 0.15, about 0.9% above 0.30, and only 0.017% above 0.60. The full s_het = 1 projection is an extreme extrapolation, not the burden carried by ordinary rare-variant carriers.
So the rare-variant effect is not "over for the carriers." It is a thin-tail adjustment.
Per unit of burden, Gardner also reports lower odds of having an email address on file with UK Biobank (OR = 0.30 in men, 0.45 in women), consistent with a broader participation/social-functioning channel. But because high burden is rare, this does not imply a large class of rare-variant-defined sexless people. It implies a small tail inside a much larger common-variant distribution.
The population-level magnitude is bounded. Gardner himself estimates that rare-variant burden explains "less than 1%" of childlessness overall. Real signal, small share. The Abdellaoui sexlessness-ASD genetic correlation of r_g = 0.26 fits the same picture: real and statistically significant, but modest. Autism is a pathway, not the main axis. A rough Bayes calculation puts autism's share of the male lifelong-sexless-at-30 population at roughly 13%; the arithmetic is in the supplementary.
That gives the right setup for the obvious follow-up. Who, if anyone, is actually genetically locked out of partnered sex?

On the combined rare + common model, the answer depends on how strict the endpoint is. At 30 the extreme top tail can look ugly; by 40, the top 1% is nowhere near deterministic.
At age 30, the top 1% of combined predisposition reaches ~43% P(sexless). The top 0.1% reaches ~71%, and the top 0.01% reaches ~87%. Crossing 90% requires roughly the top 0.005% of combined genetic risk, about 1 in 19,000 people under this model. At age 40, the same cutoffs are only ~15%, ~38%, and ~62%; crossing 90% requires roughly the top 0.00010%, about 1 in 1,000,000.
The figure below is the answer to the follow-up question. The combined curve is close to common alone, while the rare-alone curve sits far below it across the observed range. Rare variants add a small upper-tail correction; they do not create a separate large class of genetically locked-out carriers.
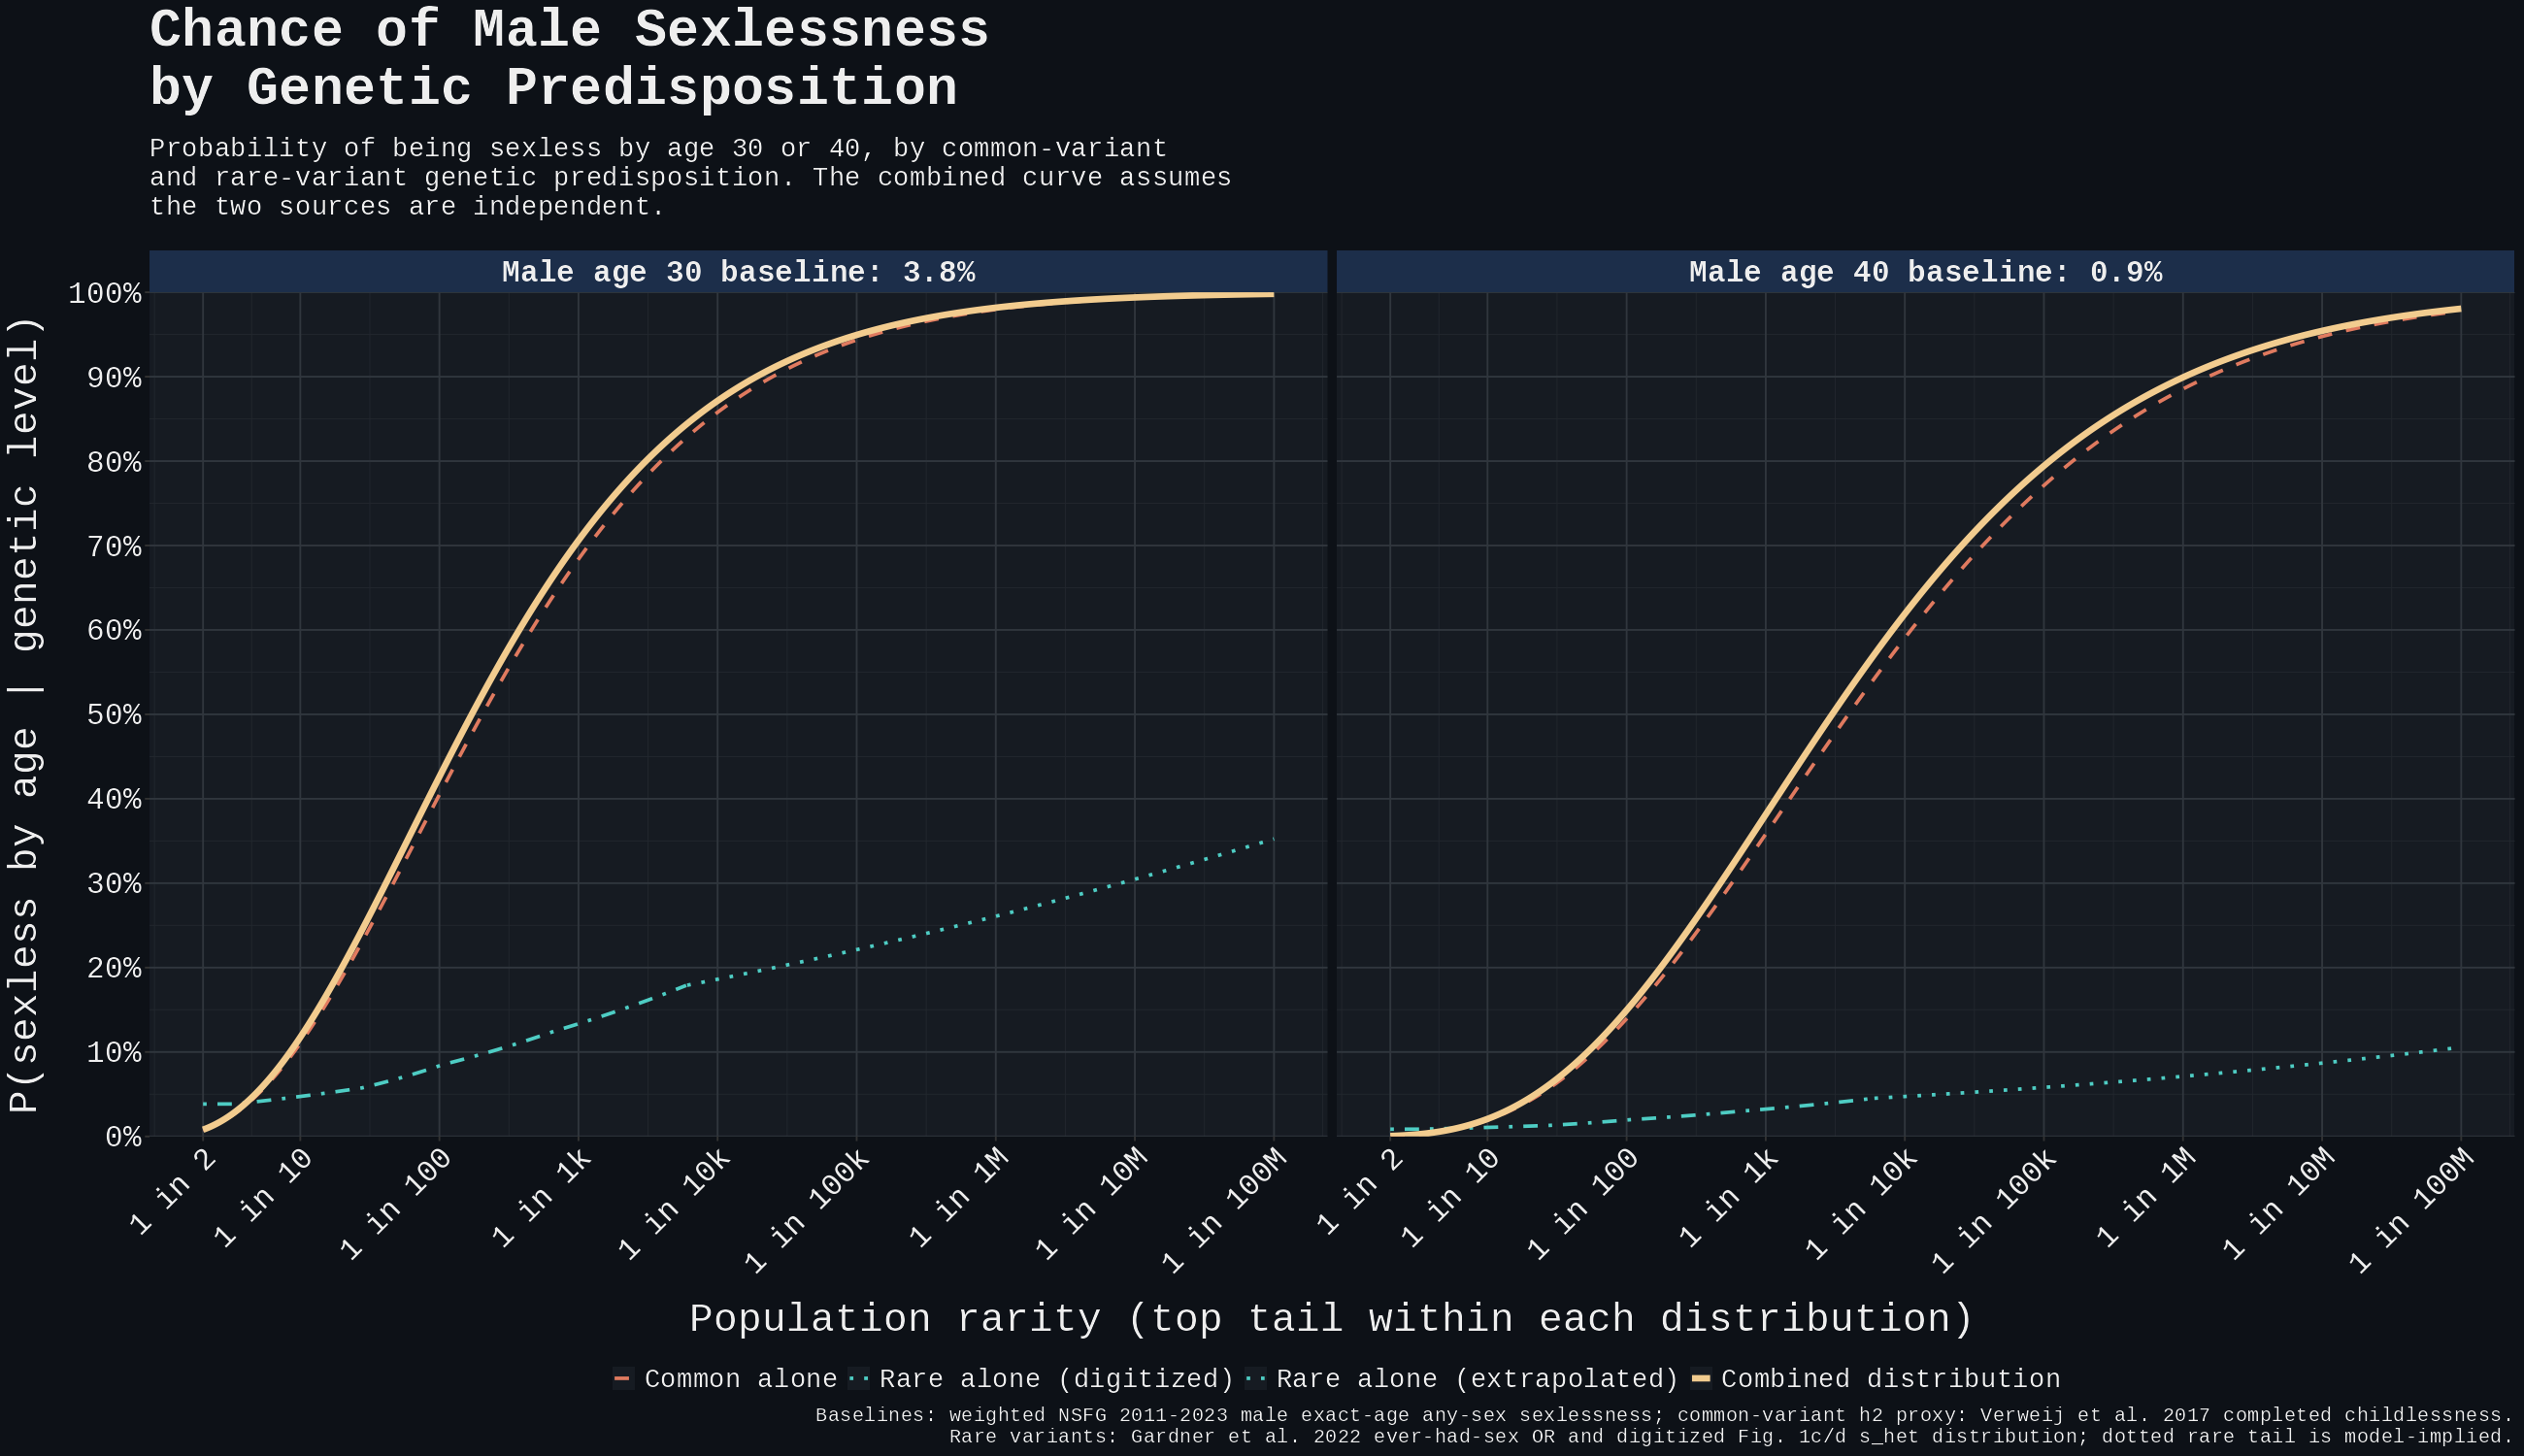 Figure 5. Combining common and rare variant risk multiplicatively under independence for male age-30 and age-40 sexlessness; rare variants add a small upper-tail correction, but the distribution is dominated by common-variant liability. The dotted rare-alone tail is a model-implied extrapolation beyond Gardner's last digitized bin, not directly observed data.
At empirically observed burden levels rare variants do not produce stronger per-carrier risk than the common-variant top of distribution. Gardner's headline 17-fold odds reduction is the slope projected to s_het = 1, a theoretical high-burden endpoint; the digitized Fig. 1c/d distribution puts the 99th percentile around s_het ≈ 0.30 and the 99.99th percentile around s_het ≈ 0.62. At the 99th percentile, rare burden alone gives roughly 8.4% P(sexless at 30) and 1.9% P(sexless at 40): elevated over the 3.8% and 0.9% baselines, but far below the 40.5% and 13.9% the common-variant additive model predicts at the same population rarity. Even at the top 0.01%, rare burden alone reaches only ~18.6% at age 30 and ~4.7% at age 40 in this projection. The "truecel locked out by their exome" framing does not describe most empirical carriers in Gardner's distribution.
The table version says the same thing. Rare variants are real, but they mostly do not move the overall risk ranking; common liability is doing the heavy lifting.
| Age | Population rarity | Common alone | Rare alone | Combined rare + common | Model-implied s_het |
|---|---|---|---|---|---|
| 30 | Top 5% (1 in 20) | 18.9% | 5.4% | 20.1% | 0.13 |
| 30 | Top 1% (1 in 100) | 40.5% | 8.4% | 42.6% | 0.29 |
| 30 | Top 0.1% (1 in 1,000) | 68.4% | 13.3% | 70.6% | 0.48 |
| 30 | Top 0.01% (1 in 10,000) | 85.8% | 18.6% | 87.1% | 0.62 |
| 30 | 90% combined threshold (1 in 19,018) | 88.9% | 19.6% | 90.0% | 0.64 |
| 40 | Top 5% (1 in 20) | 4.2% | 1.2% | 4.5% | 0.13 |
| 40 | Top 1% (1 in 100) | 13.9% | 1.9% | 15.0% | 0.29 |
| 40 | Top 0.1% (1 in 1,000) | 35.8% | 3.2% | 38.1% | 0.48 |
| 40 | Top 0.01% (1 in 10,000) | 59.0% | 4.7% | 61.9% | 0.62 |
| 40 | 90% combined threshold (1 in 1,024,122) | 88.6% | 7.1% | 90.0% | 0.77 |
Table 6. Predicted P(sexless, male) at matched population-rarity cutoffs under common variants alone, rare variants alone, and the combined rare + common model under independence.
Adding rare burden raises the far upper tail, but the combined plot and table show the same basic shape: near-determinism lives only among the rarest overall risk percentiles, especially under the stricter age-40 definition.
Different genes for men and women
The popular image of the lifelong virgin is male, and the NSFG point estimates lean that way around the main age-30 cutoff: 3.8% in men vs 1.7% in women. But these are small cells, and by age 40 the point estimates are around 1% in both sexes (0.9% M vs 1.1% F, see Table 2). The cleaner asymmetry is genetic. If sexlessness in men loads onto a different cluster of underlying traits than sexlessness in women, the genes that produce the male tail are not, by arithmetic, the same genes that produce the female tail. The pathways to sexlessness in men and women are only partly overlapping, which means "the genetics of sexlessness" is really two sets of genetics with partly disjoint architectures.13
The primary evidence is the cross-sex genetic correlation (Abdellaoui et al., 2025; Barban et al., 2016; Verweij et al., 2017):
| Phenotype | Cross-sex r_g | Source |
|---|---|---|
| Number of children ever born | 0.97 | (Barban et al., 2016) |
| Age at first birth | 0.86 | (Barban et al., 2016) |
| Lifelong sexlessness | 0.56 | (Abdellaoui et al., 2025) |
| Completed childlessness | 0.14 (twin) / −0.22 (molecular) | (Verweij et al., 2017) |
Table 7. Cross-sex genetic correlation (male vs female) for sexlessness compared with adjacent fertility traits and completed childlessness.
Verweij et al. (Verweij et al., 2017) state the sex-split result plainly:
"Although the level of the heritability of childlessness is approximately equal for both sexes, the actual genes that have a role vary."
Fertility-quantity and fertility-timing run through near-identical genes in men and women: the cross-sex correlation is 0.97 for number of children ever born, 0.86 for age at first birth. Sexlessness at 0.56 sits well below that band, far enough that the male and female DNA effects only partly track each other; substantial sex-specificity is doing real work. Completed childlessness at ~0 means the genes that cause it in men are statistically independent of those that cause it in women.
Two non-exclusive reads. The first is sexual-selection asymmetry: female mate choice is higher-variance than male mate choice, so male reproductive failure runs through a stricter and partly different filter. The biology of reproduction (number of children, age at first birth) is near-universal across sexes; the sociology of partnership formation runs through different channels.
This partly parallels incel's anguish over women not understanding their plight. Many incels feel an understandable, if regrettable, anger towards female family members whom they perceive as would-be incels if they were male. That anger is similarly mirrored towards other women; "if you were a man you'd be an incel". This is a random post I found with one search. The genetic evidence supports a narrower version of the intuition: male and female sexlessness are not genetically identical, but they are not cleanly separate phenotypes either.
The second is the rare-variant sex asymmetry from Gardner et al. (Gardner et al., 2022). Per unit of deleterious rare-variant burden, male having-any-children odds fall by roughly two-thirds (OR 0.32), while female odds fall by roughly one-third (OR 0.64). Same burden scale, larger male penalty. Kolk & Barclay (Kolk & Barclay, 2019) add the phenotypic-side complement: in Swedish military-conscription registers, the within-family IQ–fertility gradient for male completed fertility is 2× the between-family slope (their data are male-only).
The asymmetry is in the architecture, not the fate; at realistic h² for either sex the MZ concordance numbers do not approach complete determinism.
Conclusion
Taking a step back, where does the genetics blackpill stand?
Linking back to the introduction's example of schizophrenia: if you had an identical twin with schizophrenia, everything considered, the probability you would also have schizophrenia is about 40%.1
The apples-to-apples comparison is male age-40 sexlessness, because its prevalence is also about 1%. On that stricter endpoint, the top 1% of combined genetic predisposition is only around 15%.
So the schizophrenia comparison is a benchmark, not a neat equality. On the prevalence-matched age-40 outcome, schizophrenia-like risk sits closer to the top 0.1% of combined predisposition.
That is still not the same kind of fact as having an affected twin. The family comparison is lower: having an identical twin who is sexless, going with the estimates above, roughly corresponds to a 20% chance of sexlessness for age-30 men, about 6x baseline odds. Put another way, there are probably plenty of sexless individuals where sexlessness does not strictly run in the family, although it is reasonably heritable.
That is the post in miniature. Sexlessness is not genetically arbitrary: it shares a DNA-level fingerprint with completed childlessness, delayed reproduction, fewer partners, loneliness, and adjacent social traits; common variants create a meaningful upper tail; rare damaging variants add a small extra push; and the male and female architectures are only partly the same. The signal is real.
But the strong blackpill version does not survive quantification. The twin-concordance estimate lands below schizophrenia, the rare-variant contribution is small at the population level, and even the top 1% of combined genetic predisposition is still more likely than not not to be sexless. Near-determinism appears only in the far tail: around one person in 19,000 for age-30 male sexlessness and about one person in a million for age-40 male sexlessness under the model.
The clean conclusion is therefore neither "it's all environment" nor "it's over." The genetics of sexlessness look real, moderate, sex-specific, and tail-loaded. They matter, but they do not imply a genetics blackpill specifically.
That said, a more nuanced conclusion is that, realistically, there is some class of individuals for whom it is "over", where sexlessness is the result of moderately poor "environment" and genetics. I say "environment" in quotations here because it is often incorrectly thought that "environment" means you have control. This isn't strictly true. Your "environment" could be a chronic non-genetic illness that kept you out of school or university; a trauma event that left you significantly disfigured; or simply bad luck in not having the right potential partners around at the right time. None of these are exotic, and it's easy to imagine someone being unlucky in an environmental and mostly deterministic way, which therefore makes it "over" for them.
With schizophrenia, it's a similar story: stress and circumstance often trigger the symptoms of schizophrenia, not the disease alone. Said another way, genetics load the gun, but do not pull the trigger. Sexlessness could be thought of in the same way: poor genetics and circumstance.
So the more nuanced conclusion is that genetics matters, sometimes a lot, but for most people the outcome is a combination of many factors.
Footnotes
-
The schizophrenia benchmark is a shorthand over several twin papers. Sullivan, Kendler & Neale's meta-analysis estimates liability-scale h² = 0.81 (95% CI 0.73–0.90), using prevalence assumptions between 0.5% and 1%, but it reports liability correlations and variance components rather than one pooled observed concordance (Sullivan et al., 2003). The observed probandwise-concordance anchors come from primary studies: Cannon et al.'s Finnish register study reports MZ = 0.46 and DZ = 0.09 at 2.0% prevalence, with h² ≈ 0.83 (Cannon et al., 1998); Cardno et al.'s Maudsley series gives MZ ≈ 0.41–0.43 and DZ ≈ 0.00–0.05 under operational schizophrenia definitions, with h² ≈ 0.82 (Cardno et al., 1999); Hilker et al.'s Danish register study gives MZ = 0.33 (95% CI 0.20–0.49) and DZ = 0.07 (0.04–0.13) at roughly 1% prevalence, with h² = 0.789 (Hilker et al., 2018). So "~40%" is a midpoint shorthand for a 33–46% observed MZ-concordance range, and the post's Falconer check at P = 1%, h² = 0.80 gives 38%. ↩ ↩2
-
Lush (Lush, 1937) formalised Galton's (Galton, 1886) regression-to-mean observation as the breeder's equation, R = h² · S — parental deviation in, offspring deviation out, heritability the slope — on Fisher's 1918/1930 quantitative-genetic foundations. Falconer (Falconer, 1965) extended the same logic to dichotomous traits via a latent normally-distributed liability; the technical recipe is in the next footnote, the validation in the supplementary. ↩
-
The pooled mean blends waves with different field methodologies. The main phenotype uses the public 2011–2023 NSFG waves because the any-sex variables are available there, giving 51,730 respondents. The 2022–2023 cycle shifted from in-person CAPI to a web-first design with a much smaller sample, and the 2023 age-30+ prevalences run above earlier waves: 2.42% for women and 2.94% for men, versus 0.63–1.09% and 0.78–1.34% across the 2011–2019 waves. Online respondents are clearly higher for women (2.8% web vs 1.2% face-to-face at age 30+) but not cleanly higher for men (2.9% web vs 3.2% face-to-face). How much of the 2023 gap is a real cohort shift versus a mode effect is unclear, but at least some of it is plausibly methodological. The headline, low single digits past age 30, is robust either way. ↩
-
Closest direct measurement. Mustanski et al. (Mustanski et al., 2007) separately report twin heritability for a dichotomous Initiation variable (had-sex vs abstinent) at mean age 24.4 in 4,925 Finnish twins: A² = 0.67 (95% CI 0.28–0.95) for males, 0.49 (0.10–0.90) for females, with non-trivial C² (0.23 M, 0.36 F). The closest direct twin estimate of "sexlessness" in the literature, but not lifelong: 10.2% of the sample was still abstinent at age 25, against NSFG prevalence of 4.4% for women and 8.2% for men at age 25, falling to about 1% by age 40. A chunk of Mustanski's abstainers will eventually have sex, making this a delayed-debut phenotype. The direct mean (~0.58) sits above the childlessness proxy (0.47) and the r_g²-weighted triangulation (0.35); the wide CIs (0.10–0.95) comfortably contain both. We carry 0.47 as the main proxy and flag Mustanski's 0.58 as an age-25-ceiling anchor. ↩
-
Two table entries flirt with the higher end. Mustanski et al. (Mustanski et al., 2007): h² = 0.61 for male AFS in a Finnish cohort, specific to that population and shrinks in broader samples. Johnson et al. (Johnson et al., 2004): h² = 0.70 for ever-married in a US cohort where 90%+ eventually married — the liability-threshold model mechanically inflates h² when a phenotype approaches universal. ↩
-
So the heritability estimates are not just artefacts of common upbringing, but the zero-C result should be read as approximate and model-dependent rather than universal. The estimates shift with birth cohort, ethnicity, and adversity exposure, which is the broader point: heritability is a snapshot of a particular cohort in a particular environment, not a natural constant. Read the cluster as "the regime adjacent traits live in," then ask whether sexlessness sits genetically inside it. Dunne et al. (Dunne et al., 1997) give the canonical gene-environment-interaction result for this domain: pre-1952 Australian male AFS h² = 0 (C = 0.42), while the 1952-65 cohort reaches h² = 0.72 (with C halved). Same country, same trait, 25 years apart, across the sexual revolution. Mills et al. (Mills et al., 2021) document the same at molecular resolution for reproduction timing: AFB SNP-heritability rose from 9% in the 1940 cohort to 22% in the 1965 cohort, while Day et al. (Day et al., 2016) find AFS SNP-h² roughly flat across the same cohorts (0.26 to 0.28). Rodgers, Rowe & Buster (Rodgers et al., 1999) show the ethnicity/subgroup point in the nationally representative NLSY kinship sample: AFS h² = 0.51 for White respondents and 0.09 for Black respondents. Waldron, Heath, Turkheimer et al. (Waldron et al., 2007; Waldron et al., 2008) show the adversity point: AFS h² collapses to ~0 in Australian female twins exposed to childhood sexual abuse, with shared environment rising to 0.73; in the non-exposed subgroup the same trait shows h² = 0.39. ↩
-
LD Score Regression (Bulik-Sullivan et al., 2015) estimates genetic correlation from two traits' GWAS summary statistics, using ~1.3 million common HapMap SNPs (not just the genome-wide significant hits — Abdellaoui et al. report only one significant pooled-sex locus). Informally: if SNPs that weakly predict sexlessness also weakly predict childlessness in the same direction across the genome, LDSC estimates positive genetic covariance; r_g is that covariance divided by the square root of the two SNP-heritabilities. It assumes polygenic architectures and can misbehave for low-prevalence phenotypes under strong selection; the sexlessness GWAS sits near the power floor where LDSC is reliable, and Abdellaoui's r_g fingerprint agrees with bivariate-GREML in subsamples where both methods apply. ↩
-
Phenotypically, sexless respondents are unhappier (ΔR² = 1.10%), more nervous (1.06%), and marginally more neurotic (0.22%); genetically, r_g with major depression, anxiety, and neuroticism sits near zero. The strongest internal evidence against the "incels are genetically mentally ill" framing. ↩
-
Add Health Wave IV (Haydon et al., 2014): adult-virginity aORs for late puberty 0.67 (M), low cognitive performance 0.65 (F), high religiosity 0.78 (F), attractiveness per SD 1.3–1.8. GSS (Kim et al., 2017): never-married women have past-year sexless odds 4.4× married, female childlessness raises sexless odds 2.2×. Natsal-3 (Ueda & Mercer, 2019), N = 14,623: sexlessness cross-tabulates with the same partner-count, education, employment, and deprivation axes as UK Biobank. Quebec longitudinal cohort (Lucas et al., 2024): late-sexual-transition participants reach 0% parenthood by age 25 vs 12.5% in the age-typical group; male late-transitioners show adult hostility at η²p = 0.296, a prospectively measured signal pre-dating the online incel phenomenon. ↩
-
Falconer (Falconer, 1965) assumes a normally-distributed liability with mean 0 and variance 1; the phenotype is expressed when liability exceeds a threshold T = Φ⁻¹(1 − P) fixed by the population prevalence. If 1% of the population has schizophrenia, T = 2.326; if 1.7% of 30-year-old women are sexless, T ≈ 2.11. Under an AE decomposition (additive genetics plus unique environment, no shared-environment component, which is what the twin data in this post's corpus support), the MZ-twin liability correlation equals h², and concordance is the upper-right bivariate-normal tail P(L₁ > T, L₂ > T) at correlation h² divided by P. No closed form, but it computes cleanly in R via
mvtnorm::pmvnormand converges to the same answer under Monte Carlo at 10⁶ twin pairs. Falconer himself was careful about the model's limits: "twins of both sorts may well resemble each other for environmental reasons even more than non-twin sibs… The conclusions that can be drawn from twins are therefore not very precise" (p. 70). Polderman et al. (Polderman et al., 2015) quantified a related bias across 14.5 million twin pairs: reported h² averages 0.488, but Falconer's h² computed directly from raw twin correlations averages 0.593, a 10-point gap attributable to ACE-vs-ADE model selection. Applied uniformly the correction would raise the h² numbers here by ~20% proportionally; the qualitative claim is unchanged. Polderman's taxonomy also ranks reproductive behaviour near the bottom of all human-trait domains for heritability, with one of the highest shared-environment fractions (C² = 0.32) of any domain. ↩ -
The liability-threshold model calibrates well on the closest completed-adult proxy: Verweij's (Verweij et al., 2017) male childlessness gives MZ tetrachoric r = 0.50, observed casewise concordance 36.6%, and the model predicts 34.5% from h² = 0.46. Autism shows the opposite lesson — additive h² alone badly underpredicts observed concordance — but that is precisely why we anchor on childlessness here. Some generic twin-study modelling issues could push upward; cross-trait assortative mating inflating the proxy r_g (Border et al., 2022) and the phenotype mixing voluntary religious abstinence, asexuality, and situational virginity push down. Net: 20.2% as the main age-30 male estimate, 28.5% as the generous h² = 0.60 check. The evidence does not justify an autism-style uplift. Full discussion in the supplementary. ↩
-
The dichotomy doesn't move the MZ concordance numbers above. Gardner (Gardner et al., 2022) puts rare-variant burden at <1% of childlessness variance, so a worst-case correction shifts the prediction by a fraction of a percentage point. Pulling the regimes apart is mechanistic: the same aggregate heritability hides two architectures with very different per-carrier consequences, and the determinist intuition attaches to the rare-variant tail. ↩
-
Selzam et al. (Selzam et al., 2019) flag a complication: within-DZ-twin-pair polygenic-score correlations exceed the 0.50 random-pairing baseline for IQ (0.54), educational attainment (0.57), and self-rated health (0.53), consistent with assortative mating on those traits. Direct genomic evidence of AM; implies some of the "heritability of mating outcomes" is cross-generational AM transmission rather than direct genetic causation. Twin h² is, if anything, an over-estimate of the true individual-level h². ↩