Supplementary Materials
Big Data, Deep Roots
Published paper
Van Pelt, D. & Kirkegaard, E. O. W. (2026). Big Data, Deep Roots: Correlating Surname Genetic Ancestry and Socioeconomic Status across Millions of Americans. Comparative Sociology, 25, 239–280.
Publisher and DOI · Author's ResearchGate page
The published paper contains the full methods, additional figures, discussion, and supplementary analyses. The blog post combines three project figures with two plots from the referenced literature.
Surname data
Download the 10,989 surname aggregates used by the interactive explorer and Surname Guesser. Both formats include all 45 ancestry estimates, the five outcome measures, ancestry-based predictions, confidence intervals, Census summaries, and grouped ancestry estimates.
Take the data with you
10,989 surnames · all 45 ancestry estimates · outcomes, predictions & confidence intervals
Processed surname aggregates used by the game and explorer. See the data dictionary for column definitions and units.
These are processed surname-level data, not the full record-level source databases. The CSV has named columns for spreadsheets; the JSON preserves the game’s compact row format with metadata. The data dictionary explains the schema, missing values, units, and interpretation.
Estimates describe surname groups in the source samples. They should not be read as a personal ancestry report or a prediction about a particular person. Percentiles compare surnames with available data for each measure; for criminal records, a higher percentile means greater representation.
Figures and source tables
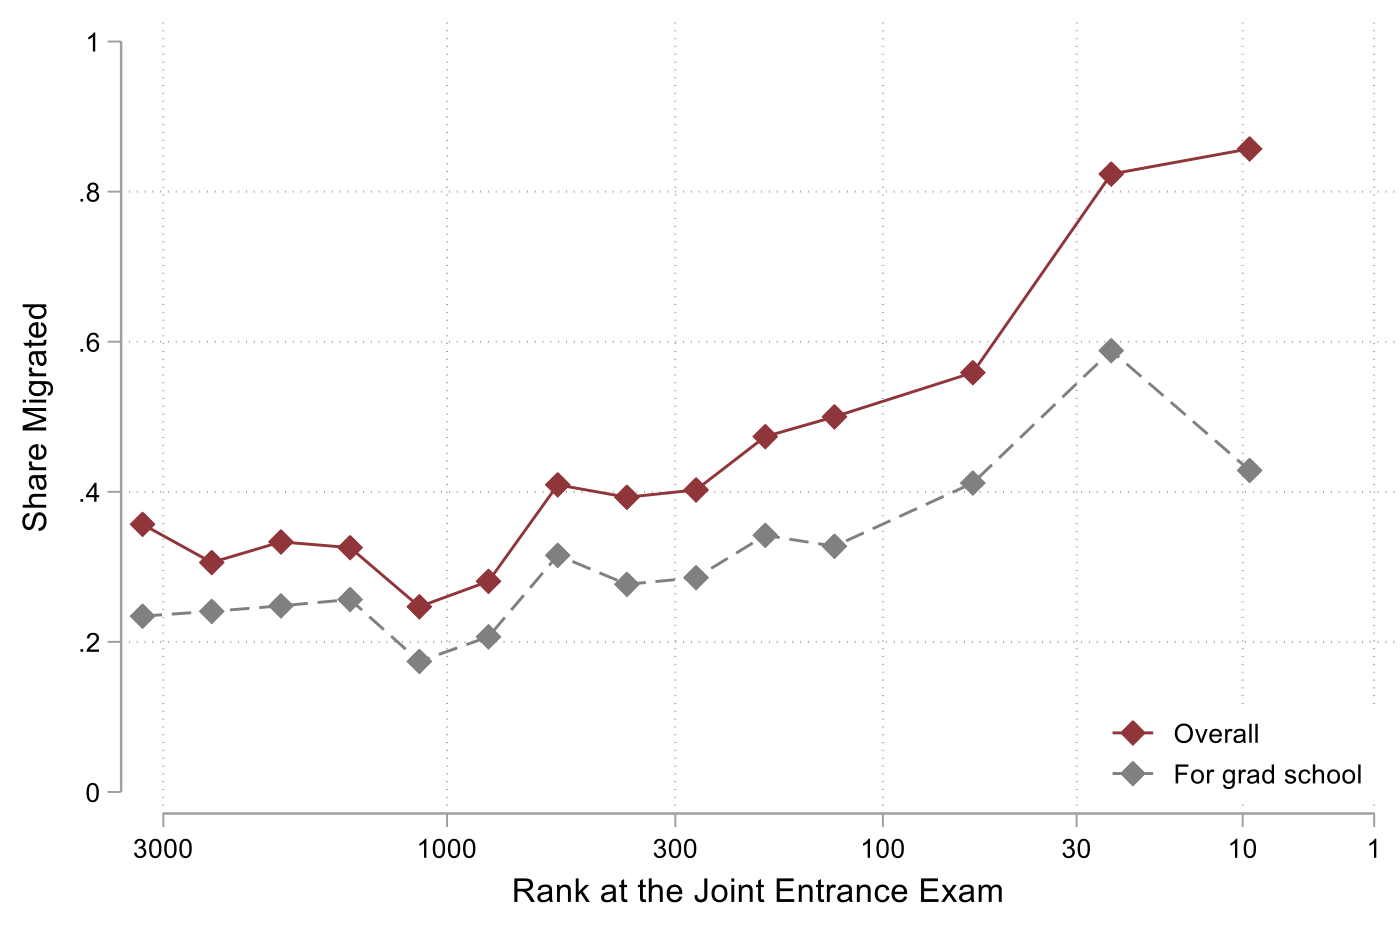
- JEE migration: Choudhury, Ganguli & Gaulé (2023), published article, Figure 1 on PDF page 5. The plot is cropped from the published PDF, preserving both series, the axes, and the legend. It follows general-category candidates in the 2010 examination through 2018; the best ranks appear on the right, and migration includes all foreign destinations.
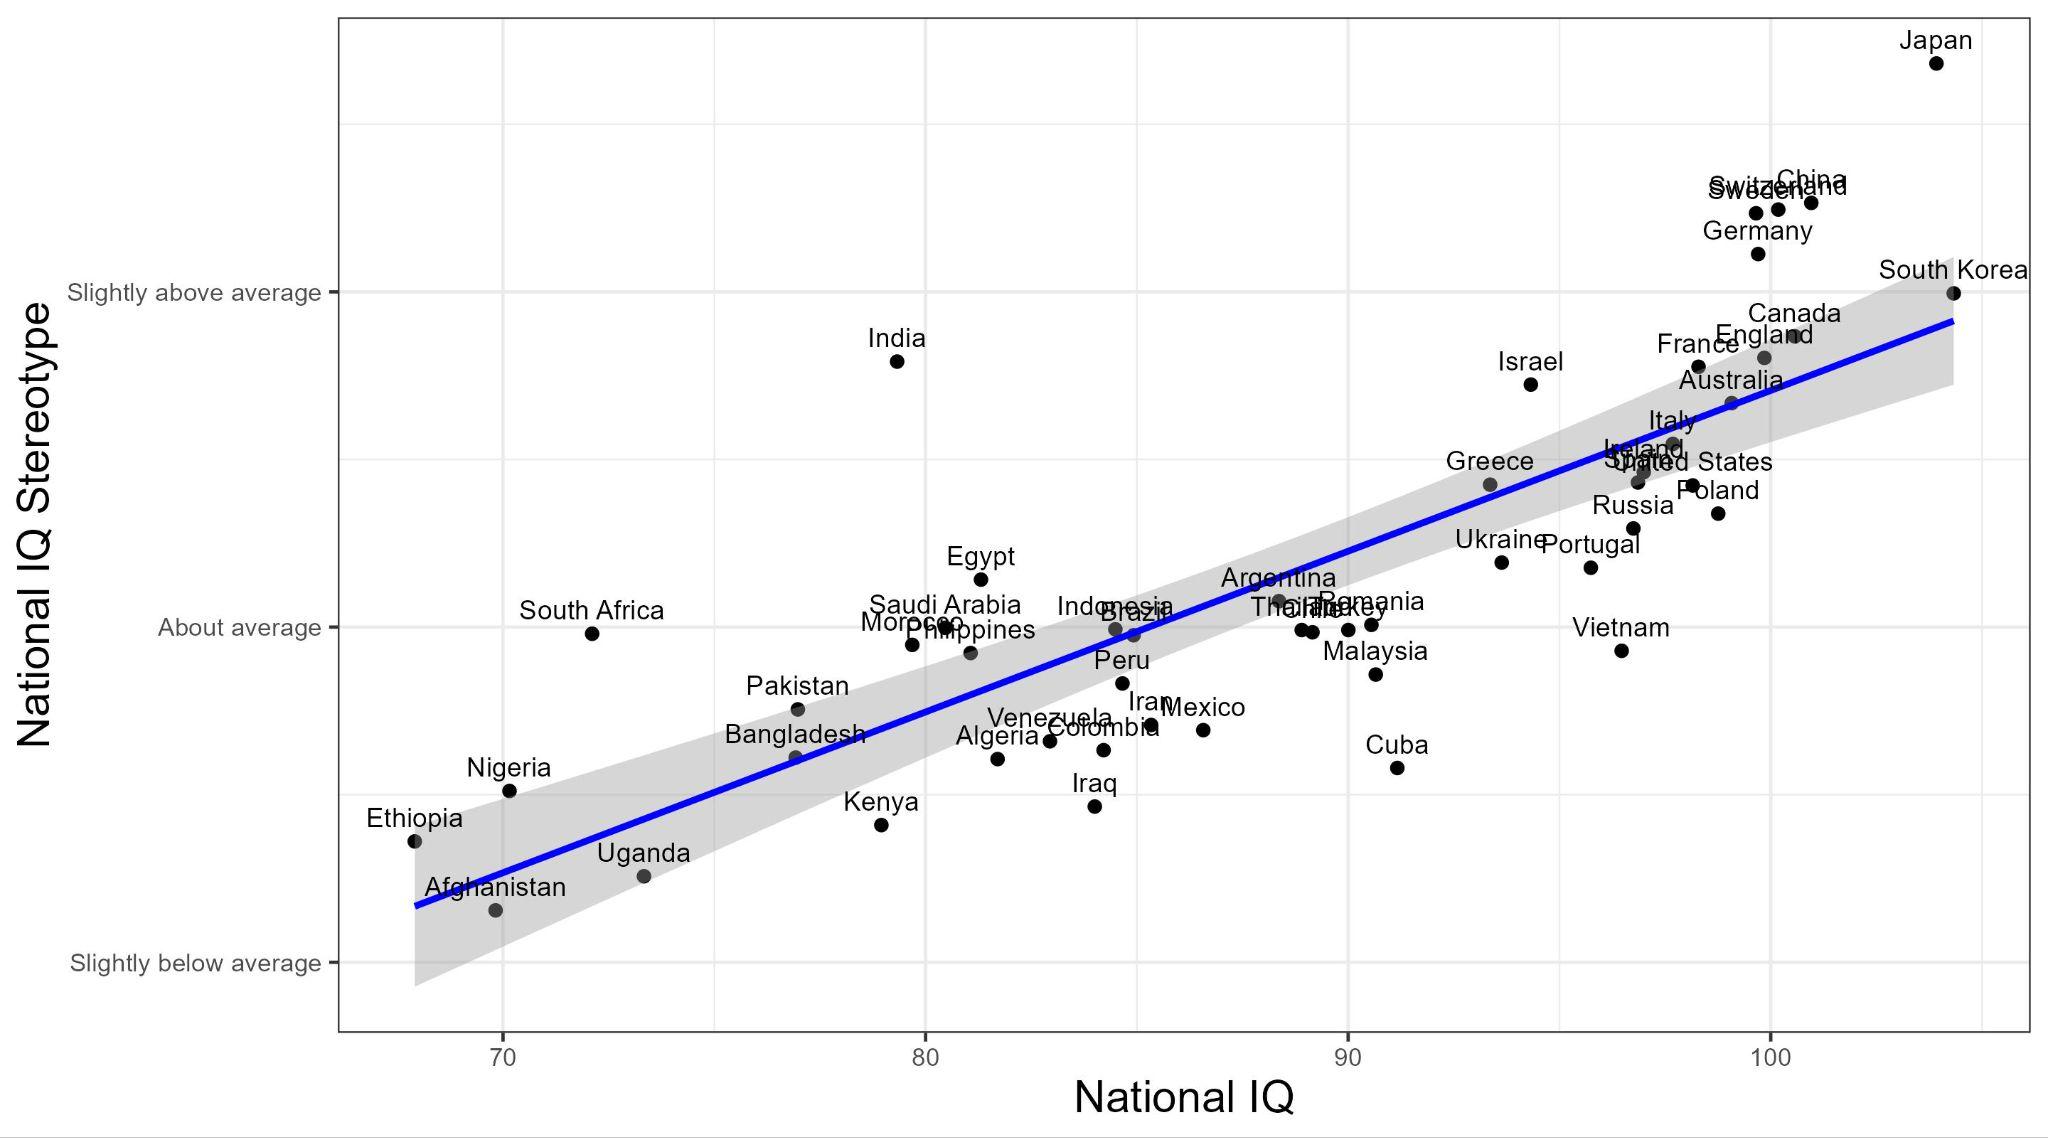
- India outlier: Jensen & Kirkegaard, public preprint, linear-fit plot on PDF page 8. The figure is extracted at its original resolution. This is the preprint illustration, not a crop of the final 2025 typeset article. It compares American respondents' average ratings with the national IQ estimates used in that study. These are distinct measures; the plot does not establish a cause for the gap or measure Indian Americans' IQ.
- Educational selectivity: Selected rows from Feliciano (2005), Table 1, printed page 140 / PDF page 10, first numeric column. The table reports the net difference index for both sexes combined. It is the probability that an immigrant has more schooling than a nonmigrant from the same origin, minus the reverse probability, after age standardization. Positive values indicate positive educational selection; they are not the fraction with a degree. The historical cohorts and comparison years vary by origin.
- Dataset sizes: The post's matched-record table reproduces the ancestry-coverage column of Table 1 in our published paper; the processed counts are retained below.
Reading the counts
The 31.6 million headline refers to the sum of the processed metric datasets in Table 1 (approximately 31,596,478 records). These overlap: occupation ratings are derived from government employment records, for example. It is not a count of distinct people.
| Metric | Processed records | Records with surname ancestry coverage |
|---|---|---|
| Criminal records | 3,802,050 | 3,398,752 |
| Salary | 14,124,647 | 9,243,123 |
| Occupational prestige | 9,803,723 | 8,314,726 |
| Wikipedia intellectuals | 65,571 | 51,464 |
| Physician licensure | 3,800,487 | 2,036,473 |
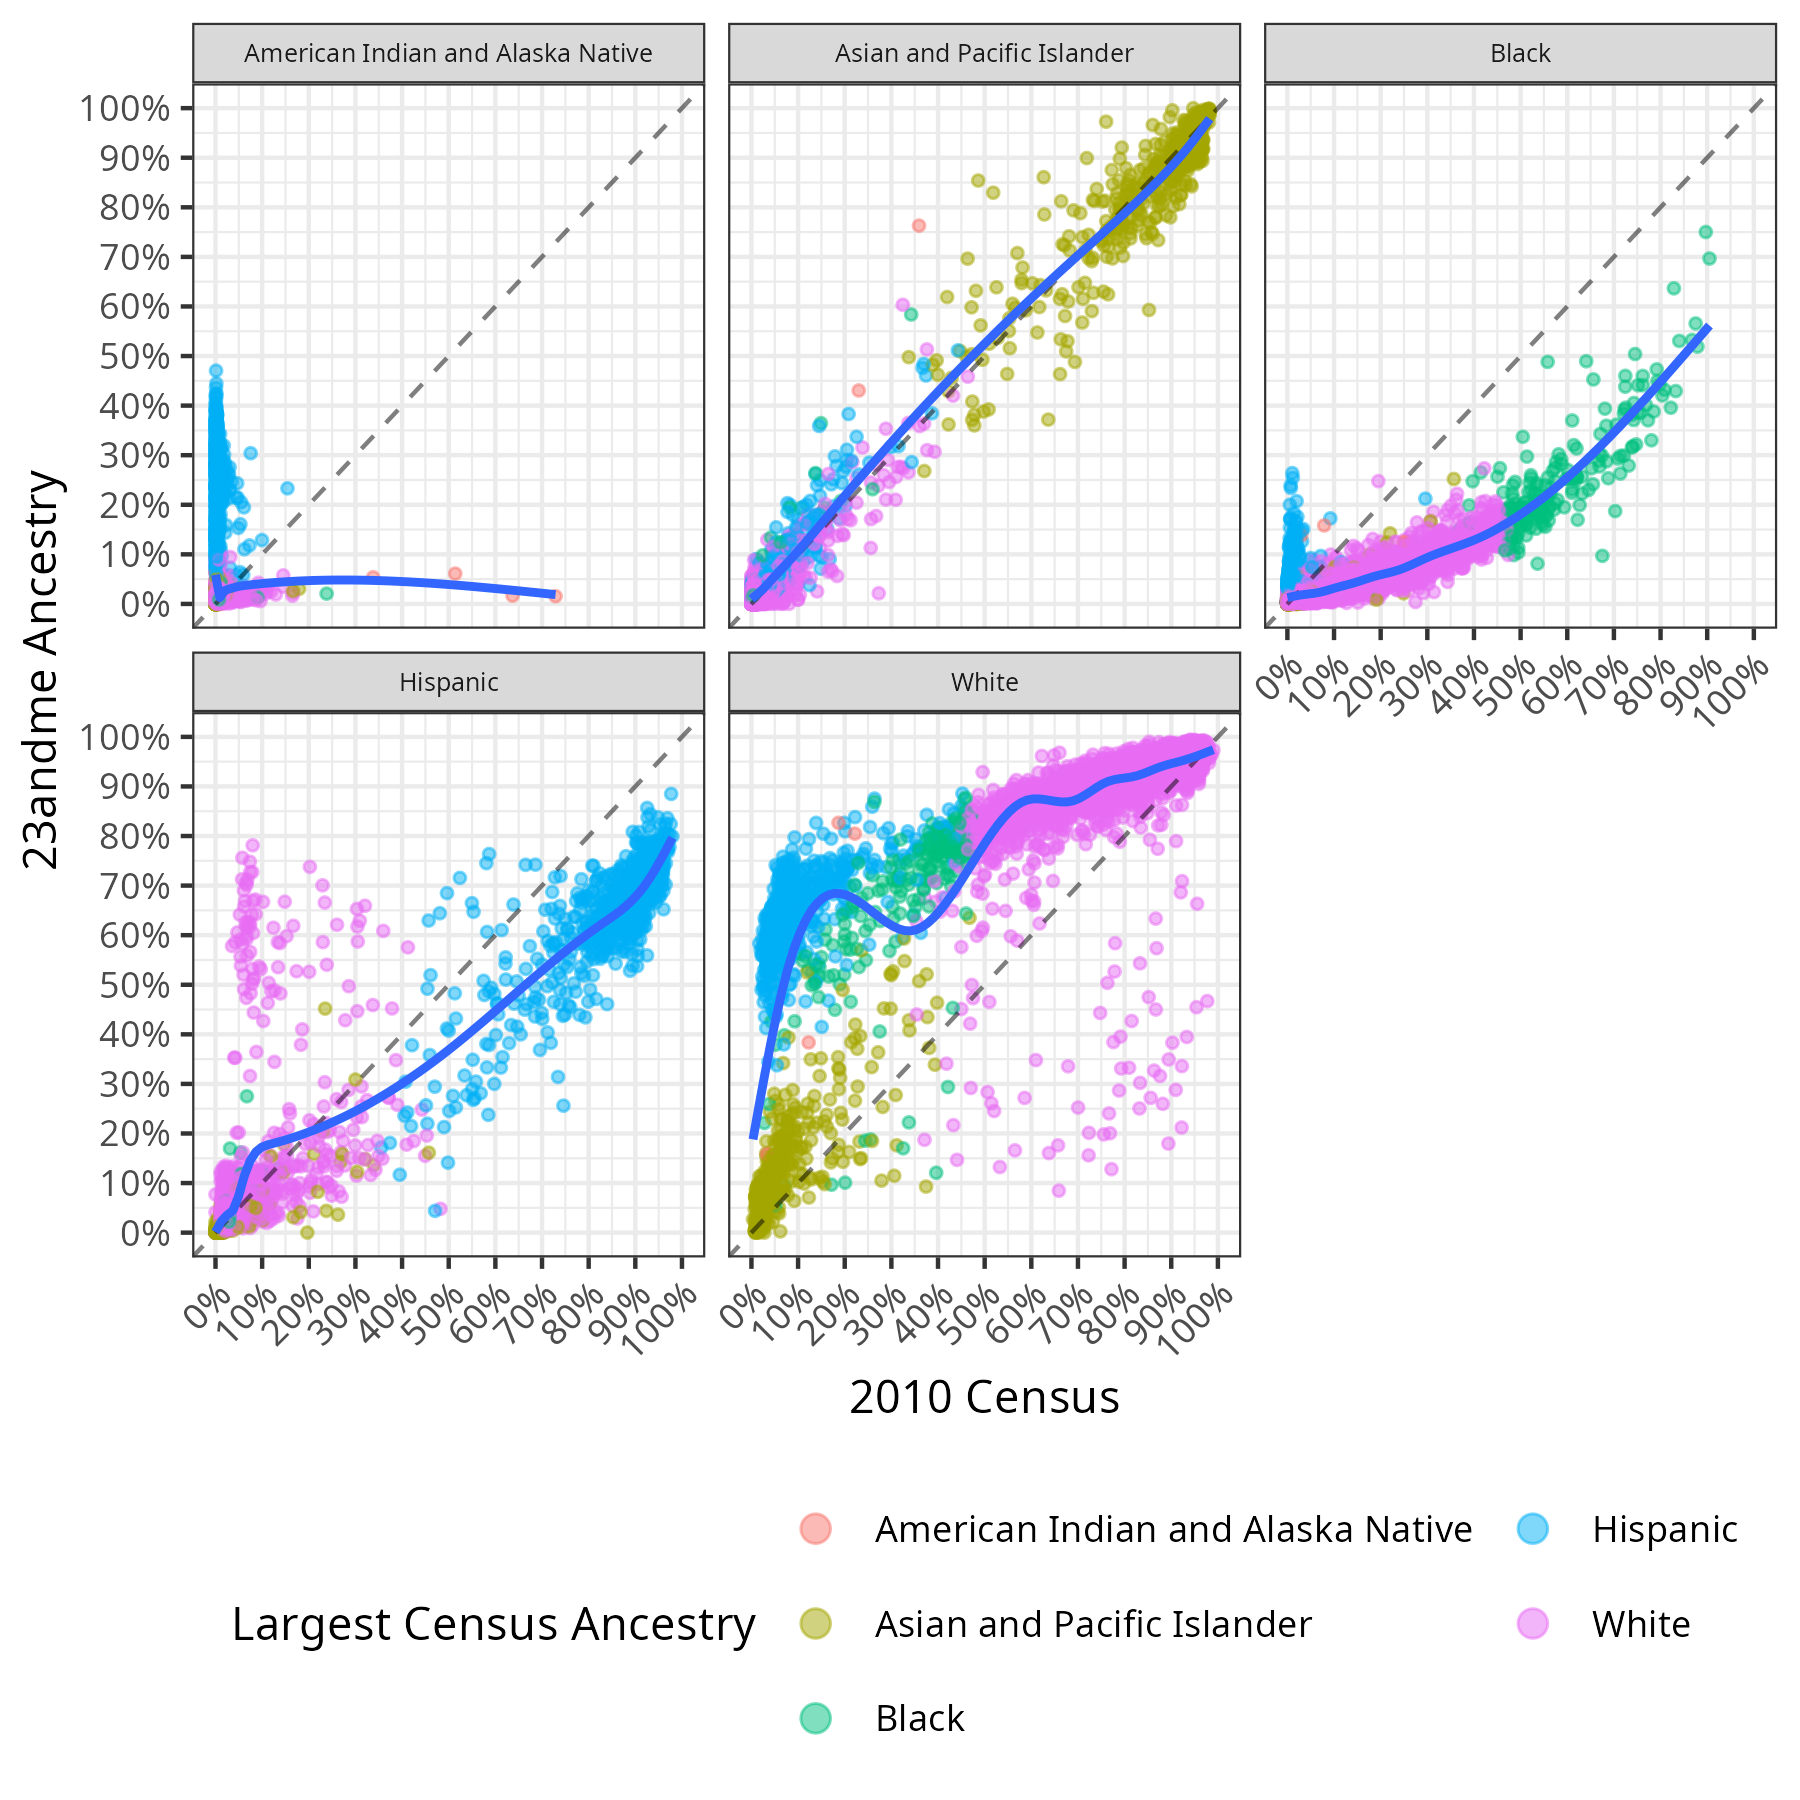
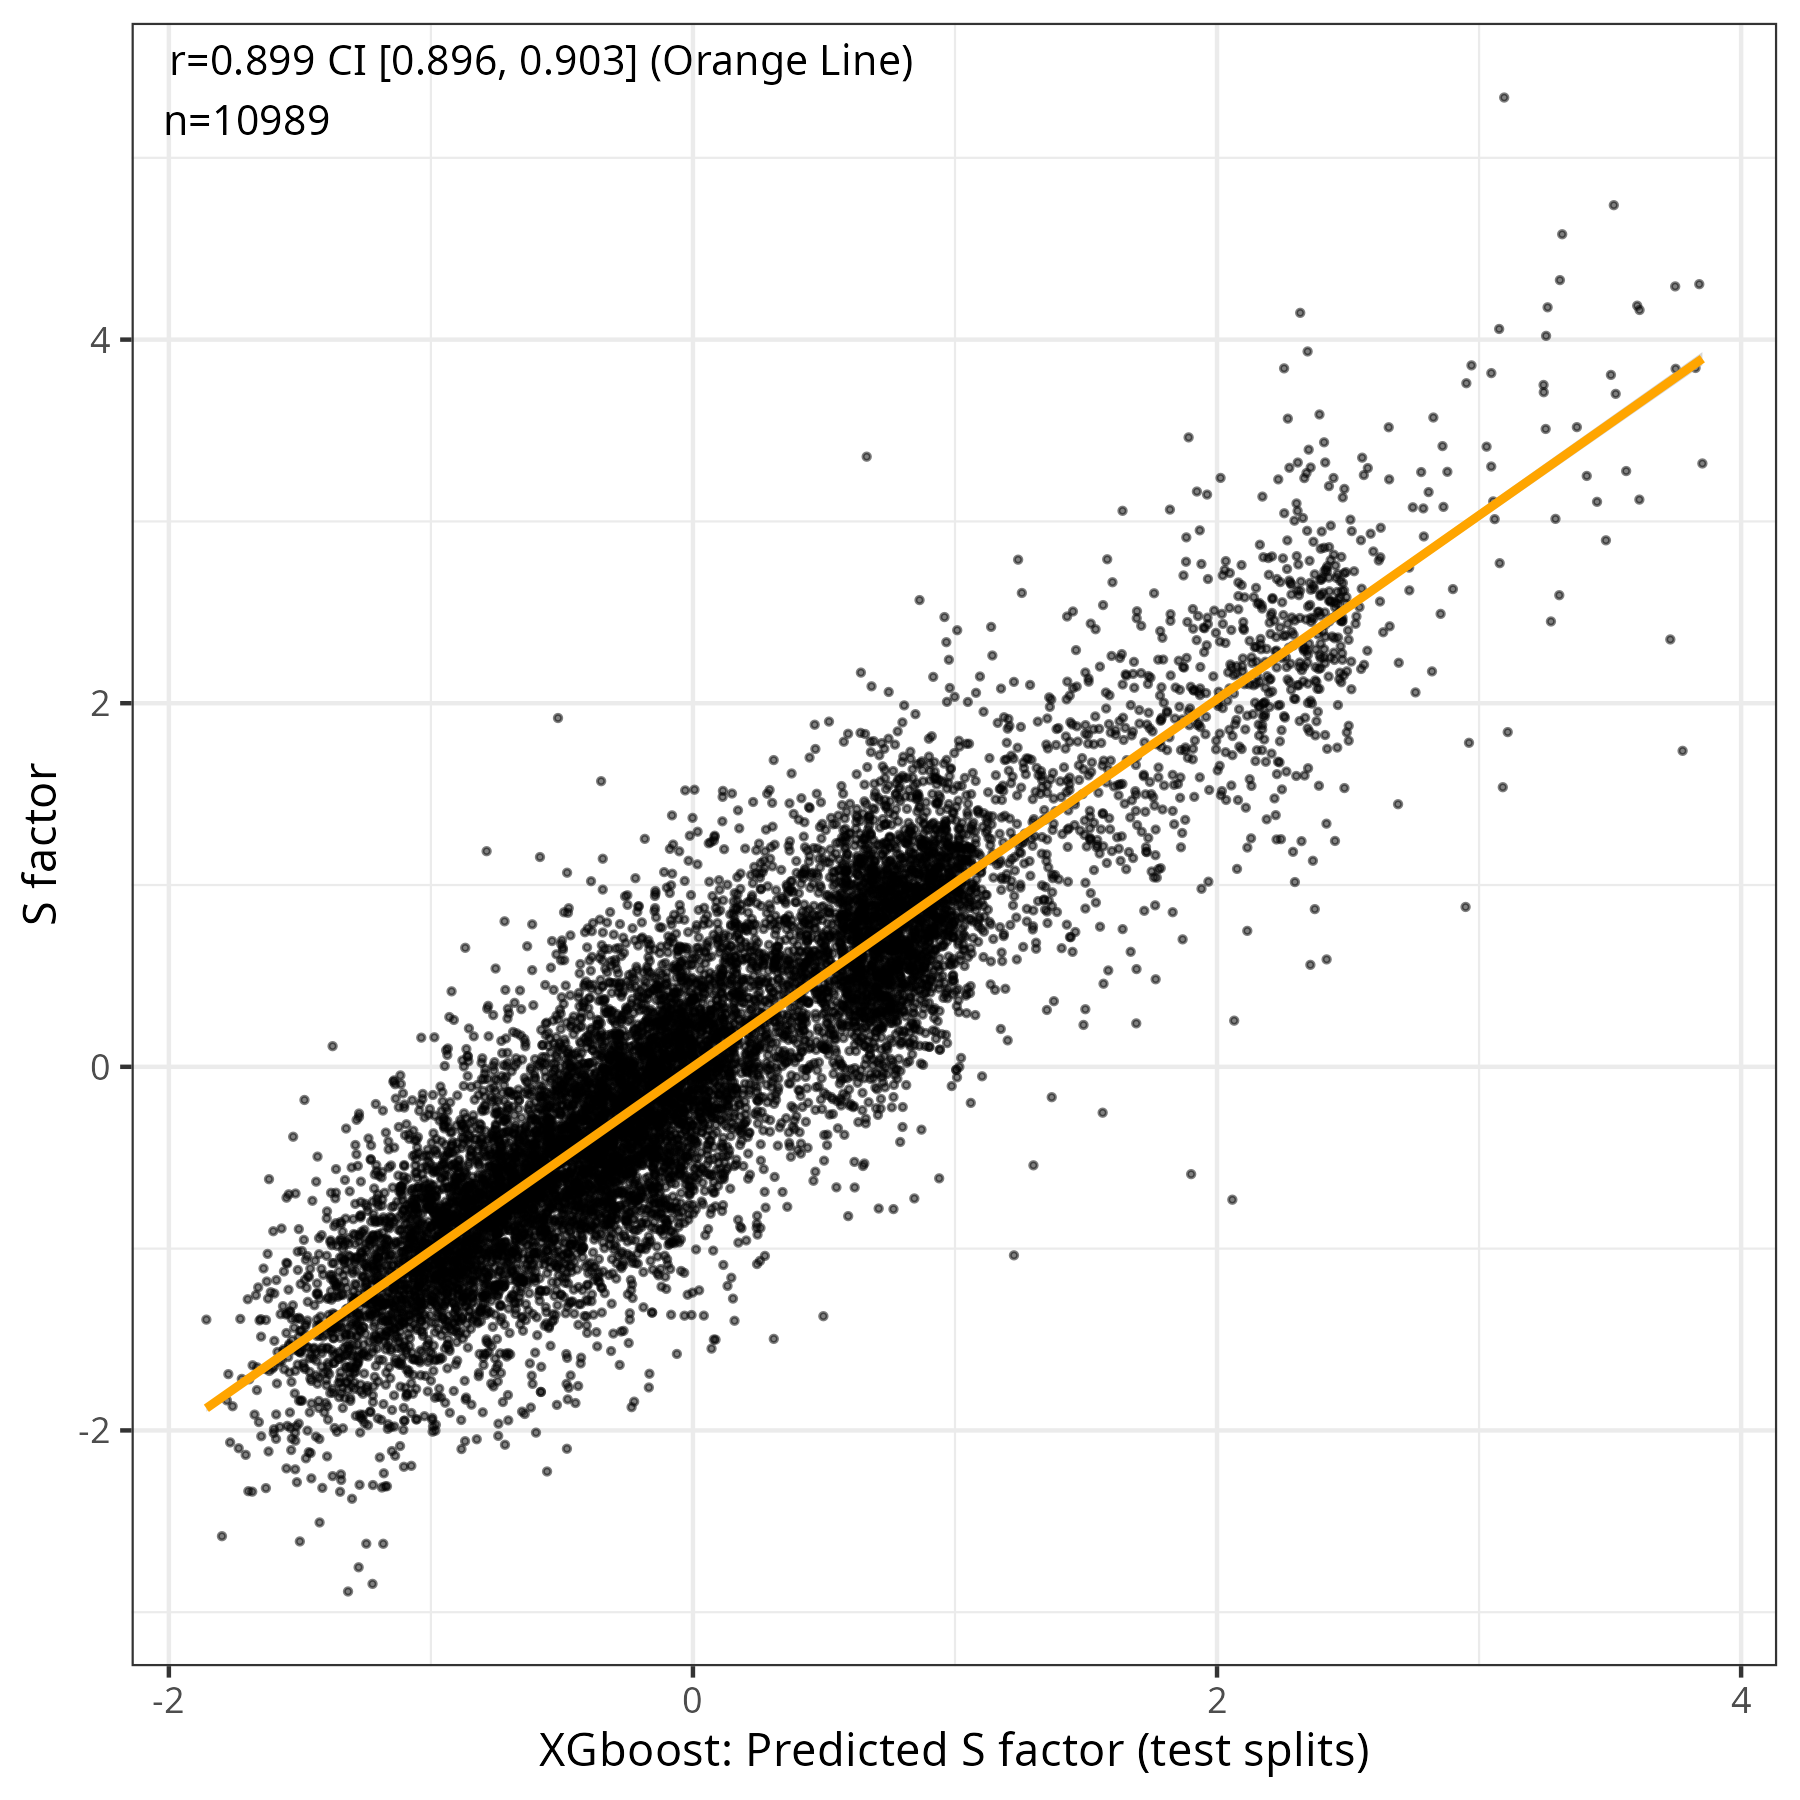
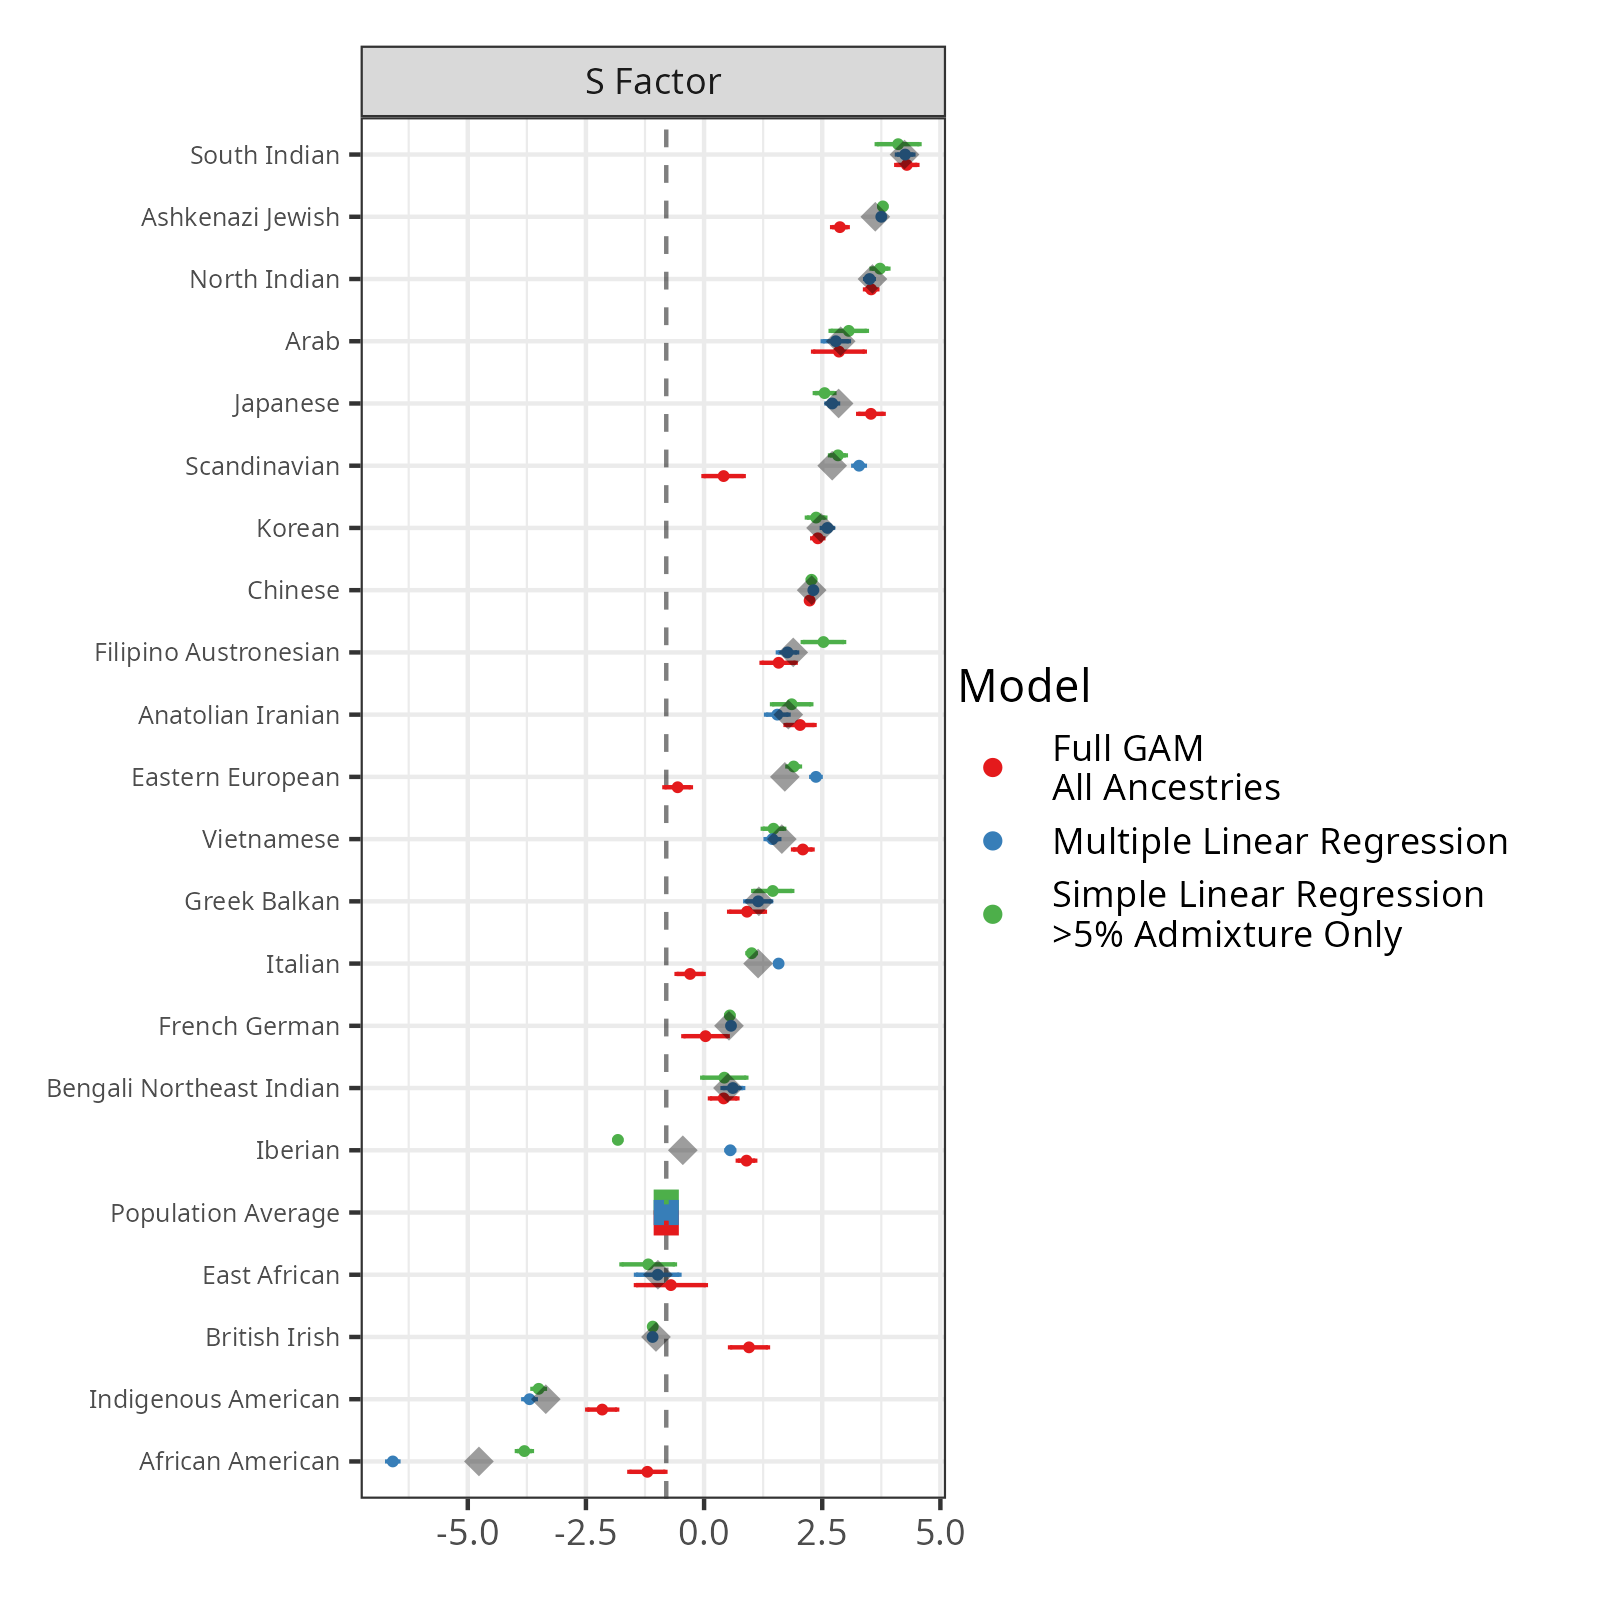
23andMe provided ancestry estimates for 11,008 surnames; 10,989 appear in the final prediction plot and the game. Wikipedia was analyzed separately and excluded from the S factor.
Migration statistics
Choudhury, Ganguli, and Gaulé's study followed the 2010 JEE cohort. Its 36%, 62%, and nine-out-of-ten figures describe migration abroad among the top 1,000, 100, and ten scorers, respectively. The United States was the main destination, not the only destination. The post uses this distinction when summarizing the paper and thread.
Iranian American survey
The demographic table on page 19 of PAAIA's 2025 survey reports 24% Muslim, 34% with a four-year degree, and 45% with postgraduate education. The latter categories total 79%, so the post uses 79% rather than the 87% mentioned in the paper's discussion. These are survey estimates from 425 respondents.