Are Incels Rising?
Three major US datasets confirm rising sexlessness in youth, but inequality is more relative than absolute.
TL;DR
-
Analysis of three major US datasets (YRBSS, NSFG, GSS) confirms increasing sexlessness and later loss of virginity among youth.
-
Relative sexual inequality is increasing (Gini coefficient) due to an increase in virgins, but absolute inequality is declining.
-
Reasons for being a virgin appear to be increasingly involuntary or ambiguous, rather than voluntary.

Introduction
Over the past few years, discussion of "the rise of sexlessness" has reached fever pitch in certain corners of the internet. You've probably seen this infamous plot making the rounds:
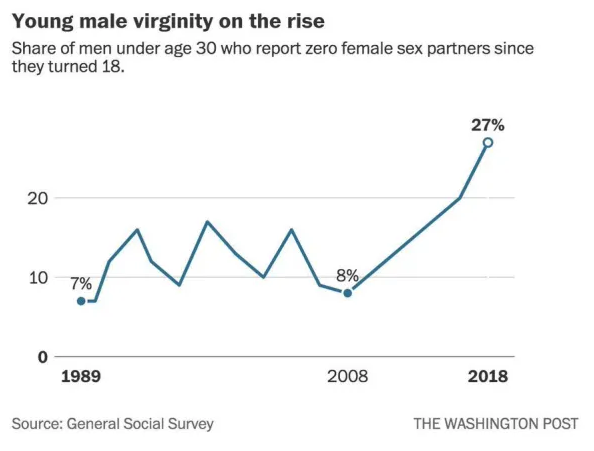
Figure 1: The widely-circulated Washington Post chart showing rising virginity rates among young American men, often cited in viral discussions of male sexlessness.
Despite being outdated and analytically shallow, this chart continues generating clicks and heated debates. While serious researchers have long moved past such sensationalism, there's still a gap in the literature that needs addressing.
As far as I can tell, no one has comprehensively examined all three major US datasets on this topic simultaneously. Analysts typically focus on either the NSFG or GSS, with the YRBSS rarely getting attention. This fragmented approach leaves room for cherry-picking and incomplete conclusions.
What we really need is comprehensive international meta-analysis covering not just sexual behavior, but related developmental milestones: first employment, substance use, social relationships. Think Jean Twenge's work on iGen, but broader in scope and geographic coverage. Since that ambitious project exceeds my current resources, I'm focusing specifically on sexlessness trends within the United States.
Note, I did attempt an international analysis a few months later anyway
This geographic limitation comes with important caveats. American trends don't automatically generalize globally, and the evidence I've reviewed suggests rising sexlessness may be uniquely American rather than a universal phenomenon among developed nations.
It's tempting to assume that social changes in the US eventually spread to other Anglosphere countries and beyond, and this pattern does hold for many trends like declining fertility, certain cultural movements, etc. But we should resist reflexive assumptions about universality without proper cross-national evidence.
Overview
This analysis draws on three complementary US datasets, each offering distinct strengths and limitations:
- Youth Risk Behavior Surveillance System (YRBSS)
- National Survey of Family Growth (NSFG)
- General Social Survey (GSS)
| Dataset | Sample Size | Time Span | Age Range | Partner Count | Sex Frequency | Explicit Virgin |
|---|---|---|---|---|---|---|
| YRBSS | ~234,000 | 1991-2023 | 12-18 | Yes | No | Yes |
| NSFG | ~87,000 | 2002-2023 | 15-50 | Yes | No | Yes |
| GSS | ~35,000 | 1989-2022 | 18-89 | Yes | Yes | No |
Table 1: The three US datasets analyzed. YRBSS has the largest sample (~234k, 1991–2023) but covers only ages 12–18; GSS spans the widest age range (18–89) and uniquely measures sex frequency.
These figures reflect sample sizes after filtering for relevant variables. Sample size alone doesn't tell the whole story; the age ranges and time periods each survey covers matter enormously for statistical power. When we account for both dimensions, the effective density per age-year cell works out to roughly 1,218 for YRBSS, 118 for NSFG, and just 15 for GSS.
This makes the GSS appear weakest statistically, trailing the YRBSS by nearly two orders of magnitude. But the GSS offers unique advantages that justify its inclusion: it's the only survey measuring sexual frequency (beyond just partner counts) and provides crucial data on older generations. These capabilities prove essential for understanding broader demographic patterns.
Each dataset illuminates different aspects of American sexual behavior. The YRBSS excels at tracking youth trends over time, the NSFG captures detailed sexual histories during prime reproductive years, and the GSS offers the broadest age range with the longest historical perspective.
Sexlessness in the YRBSS
Let's start with the YRBSS, which provides our longest-running view of youth sexual behavior. The central question: is sexlessness actually rising?
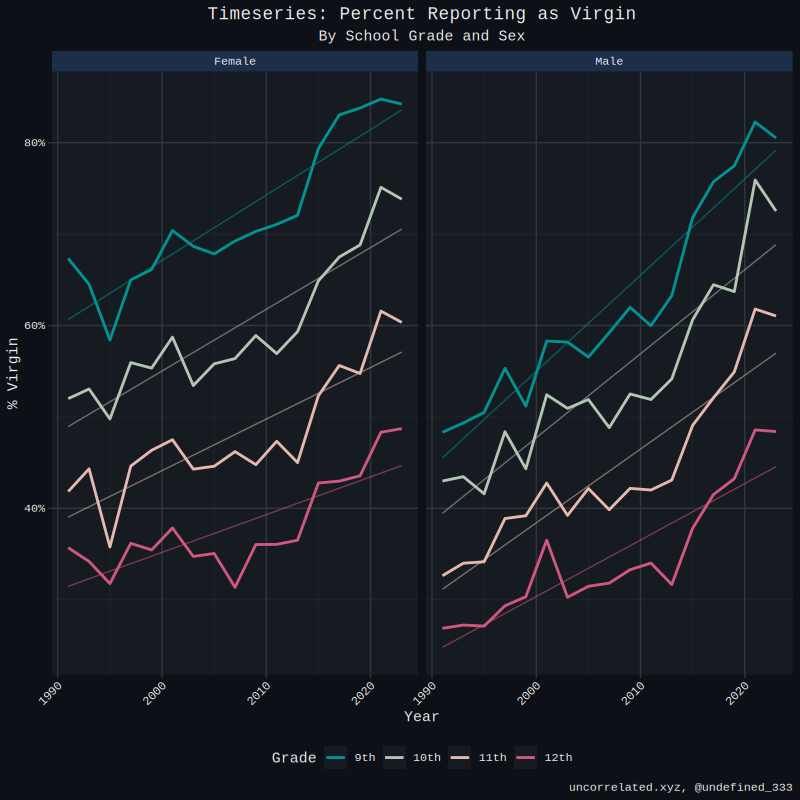
Figure 2: YRBSS virginity rates by sex, 1991–2023. Both sexes show rising sexlessness, but the increase is steeper among males, widening the gender gap over time.
The answer appears to be a resounding yes. What's particularly striking is that the trend is accelerating faster among males than females, a difference that reaches statistical significance, as we'll see in the regression results below.
To get a clearer picture of timing, I used a spline model to predict virginity rates by age, then calculated the exact age at which virginity drops below 50% of the sample. Think of this as the median age of virginity loss:
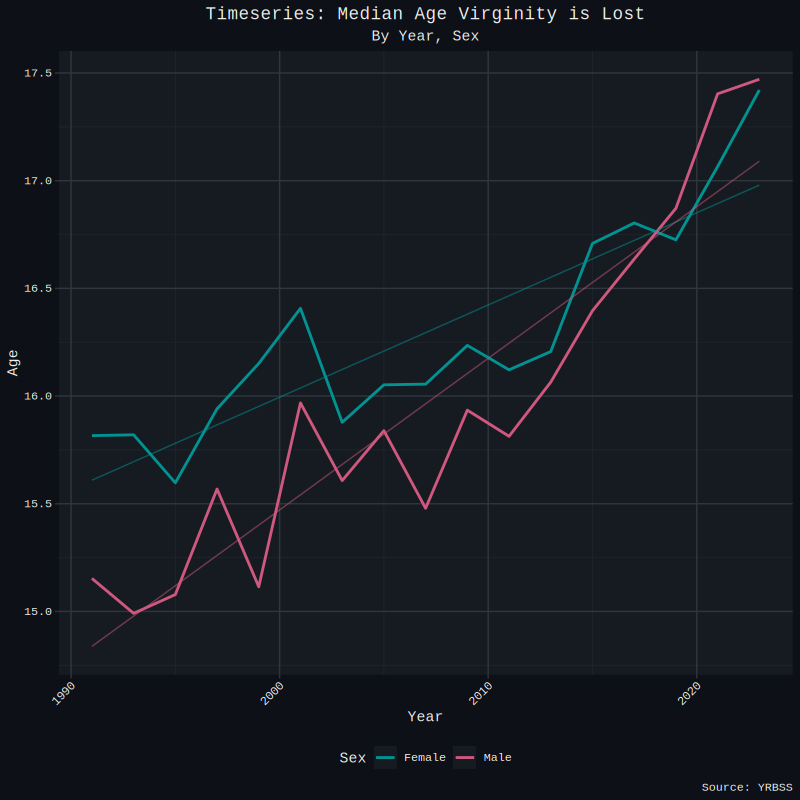
Figure 3: Spline-estimated median age at virginity loss in the YRBSS. The age at which 50% of teens have lost their virginity is rising by roughly six months per decade.
The trend is remarkably consistent: approximately six months later every decade. While this might seem modest, it represents a meaningful shift in the timing of sexual debut across generations.
Inequality in the YRBSS
Beyond simple trends in sexlessness, we can examine how sexual experiences are distributed across the population. This requires distinguishing between two types of inequality: absolute and relative.
Absolute inequality measures raw differences using metrics like variance or mean absolute error. Relative inequality, on the other hand, uses functions like the Gini coefficient that economists favor because they capture proportional differences.
Here's why this distinction matters: Imagine 10% of the population owned all the wealth in a society. If that 10% doubled their wealth, the Gini coefficient wouldn't budge, but the absolute gap between rich and poor would double. Conversely, if the wealthy lost half their money, the Gini would stay constant even as absolute differences shrank. Keep this in mind as we examine the data.
Now, let's apply this framework to sexual behavior. What patterns do you see here?
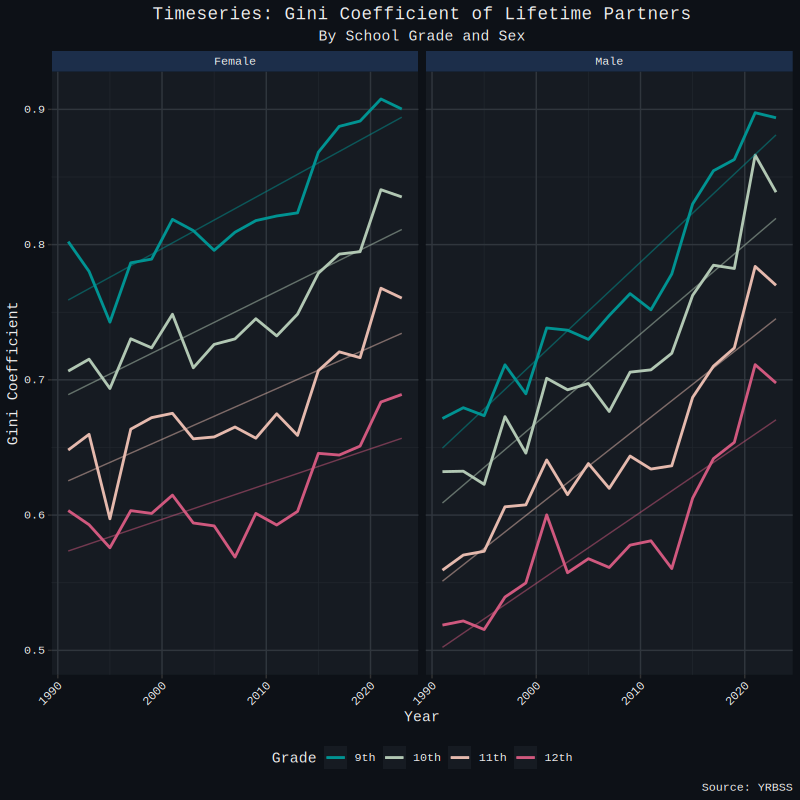
Figure 4: Gini coefficient of lifetime partner counts in the YRBSS. Relative inequality in sexual experience has risen markedly, mirroring the trend in virginity rates.
This looks suspiciously similar to our virginity plot. Is that a coincidence? Let's check the correlation:
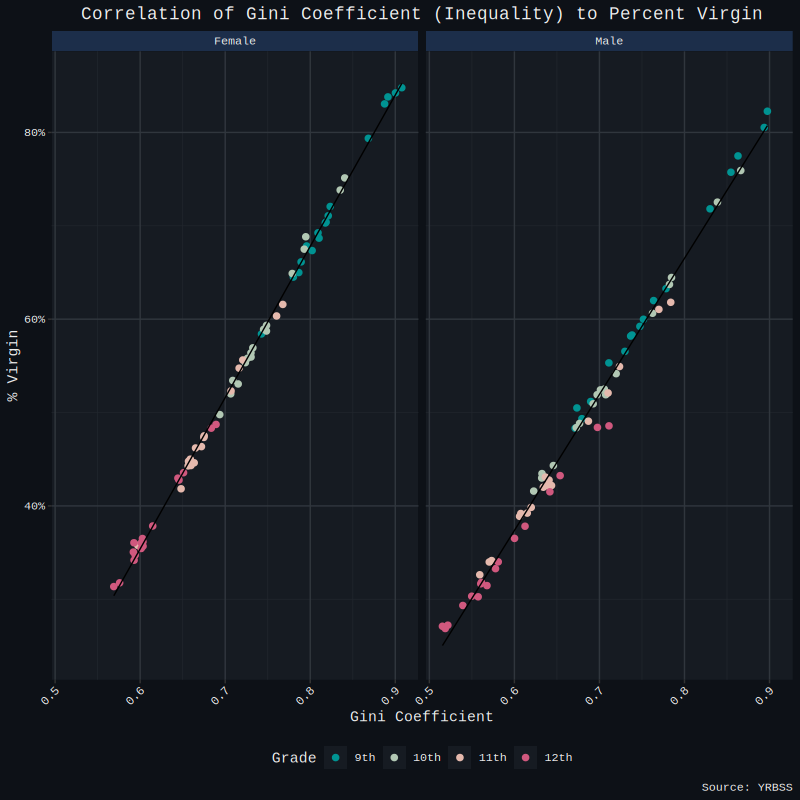
Figure 5: Scatter of YRBSS Gini coefficient against virginity rate (r = 0.996). Almost all rising relative inequality is driven by the rising share of virgins, not by changes among the sexually active.
The correlation is nearly perfect at r = 0.996. This tells us something crucial: virtually all the rising relative inequality stems from increasing virginity rates, not from changes in behavior among sexually active students.
To dig deeper, let's examine lifetime partner counts broken down by decile, grade, and sex, computing each group's deviation from the overall mean. Values closer to zero indicate that group's average is closer to the population mean.
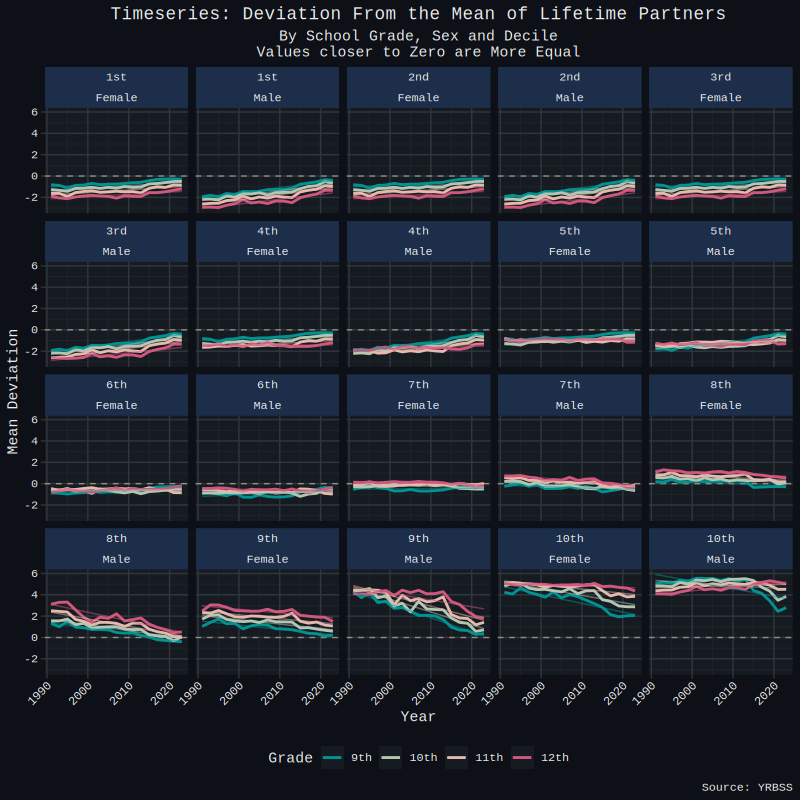
Figure 6: YRBSS partner-count deviations from the overall mean by decile, grade, and sex. Most deciles converge toward zero over time, indicating declining absolute inequality despite rising relative inequality.
Here's the paradox: despite massive increases in relative inequality, absolute inequality is actually declining across nearly all groups.
There's one notable exception: men in the 10th decile among 12th graders show increasing deviation. This reflects a data artifact: the highest response category caps at "6 or more partners." When overall sexual activity declines, this ceiling effect makes the top decile appear to diverge more from the mean, even though their actual behavior may not be changing much.
The Lorenz curve provides another illuminating perspective on these trends:
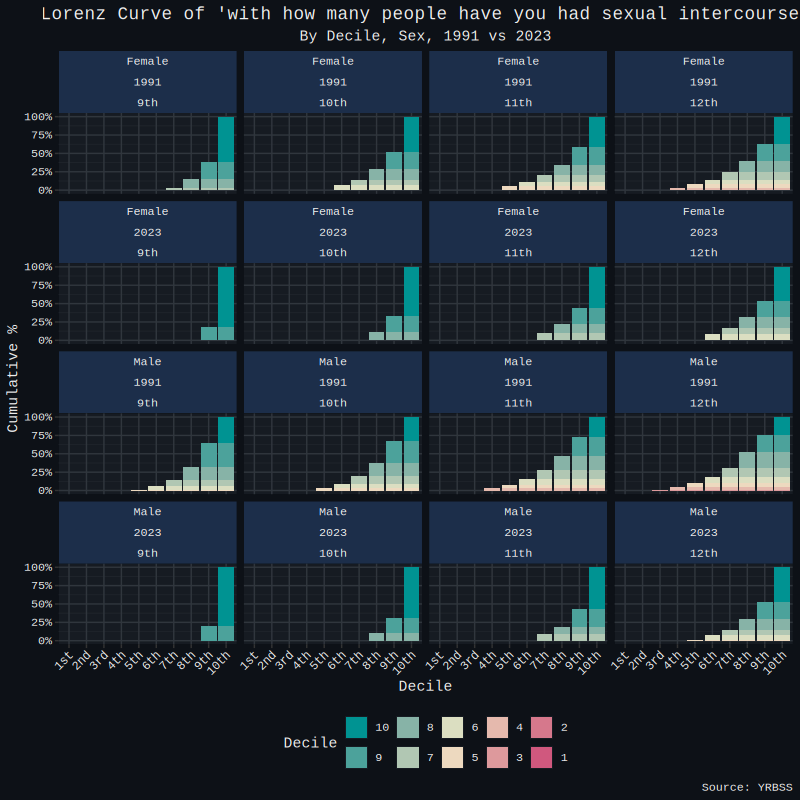
Figure 7: Lorenz curves of lifetime partner counts among 12th-grade males in 1991 vs 2023. The top 10% now account for roughly 50% of partners (up from 25%), and the bottom 30% report none.
The inequality shift is stark. Among 12th grade males in 2023, the top 10% account for 50% of all partner counts, double the 25% figure from 1991. Perhaps more telling: back in 1991, even students in the bottom 30% were having some sexual experiences. Today, roughly half report none at all.
YRBSS Conclusions
This analysis suggests we can actually steelman the Incel argument. The grievances may indeed stem from rising inequality, but it's specifically relative inequality that matters, not absolute trends. Consider the perspective of today's average high school graduate: he's now likely to be a virgin, watching a smaller group of peers account for most sexual activity. This concentration simply didn't exist a generation ago.
The YRBSS data reveals several clear patterns:
- Rising sexlessness among youth
- Increasing relative inequality in sexual experiences
- Declining absolute inequality (the paradox mentioned above)
One common Incel claim, that women are completely unaffected by these trends, proves false. However, the data does show women are less affected than men in both sexlessness and virginity trends.
The statistical models confirm these observations:
Sexlessness:
lm(virgin ~ year * sex_coded + year * grade_coded, data = virgin) %>%
  broom::tidy() %>%
  arrange(p.value)
The fitted coefficients:
| term | estimate | std.error | statistic | p.value |
|---|---|---|---|---|
| year | 0.00756 | 0.000723 | 10.5 | 8.27e-19 |
| (Intercept) | -14.5 | 1.45 | -9.97 | 1.26e-17 |
| year:grade_coded12th | -0.00369 | 0.000915 | -4.04 | 9.37e-5 |
| sex_codedMale | -5.21 | 1.30 | -4.01 | 1.02e-4 |
| year:sex_codedMale | 0.00257 | 0.000647 | 3.97 | 1.20e-4 |
| grade_coded12th | 7.10 | 1.84 | 3.87 | 1.75e-4 |
| year:grade_coded11th | -0.00199 | 0.000915 | -2.17 | 3.17e-2 |
| grade_coded11th | 3.78 | 1.84 | 2.06 | 4.18e-2 |
| year:grade_coded10th | -0.000874 | 0.000915 | -0.955 | 3.41e-1 |
| grade_coded10th | 1.65 | 1.84 | 0.899 | 3.70e-1 |
Table 2: YRBSS regression of virgin status on year, sex, and grade interactions, sorted by p-value. The significant positive year:sex_codedMale interaction indicates men are more affected by the rising sexlessness trend than women.
Mean Virginity:
lm(`Virgin Age` ~ year * Sex, data = threshold_ages) %>%
  broom::tidy()
The fitted coefficients:
| term | estimate | std.error | statistic | p.value |
|---|---|---|---|---|
| (Intercept) | -69.6 | 13.8 | -5.05 | 0.0000202 |
| year | 0.0428 | 0.00687 | 6.23 | 0.000000730 |
| SexMale | -55.7 | 19.5 | -2.86 | 0.00772 |
| year:SexMale | 0.0276 | 0.00972 | 2.84 | 0.00805 |
Table 3: YRBSS regression of median virginity-loss age on year and sex. The positive year:SexMale interaction confirms the median age of virginity loss is rising faster for men than women.
While these YRBSS results aren't overwhelmingly significant, they point consistently in one direction. The crucial question becomes: do these patterns replicate across other datasets?
Sexlessness in the NSFG
When I originally examined these trends, NSFG data only covered through 2019, and the sexlessness patterns appeared relatively modest. The 2023 data release changed that picture dramatically.
For years, the NSFG's substantial sample size advantage over the GSS made it a favorite reference point for those dismissing claims about rising sexlessness. That changed with the latest release, which shows unmistakable increases across multiple metrics.
The old arguments against these trends have lost their foundation:
First, while the NSFG covers the shortest time period of our three surveys, making trend detection more challenging, the recent patterns are too pronounced to ignore. Second, the YRBSS actually maintains a larger overall sample size. Most importantly, the newest NSFG data clearly demonstrates rising sexlessness regardless of these methodological considerations.
The visualizations tell a consistent story:
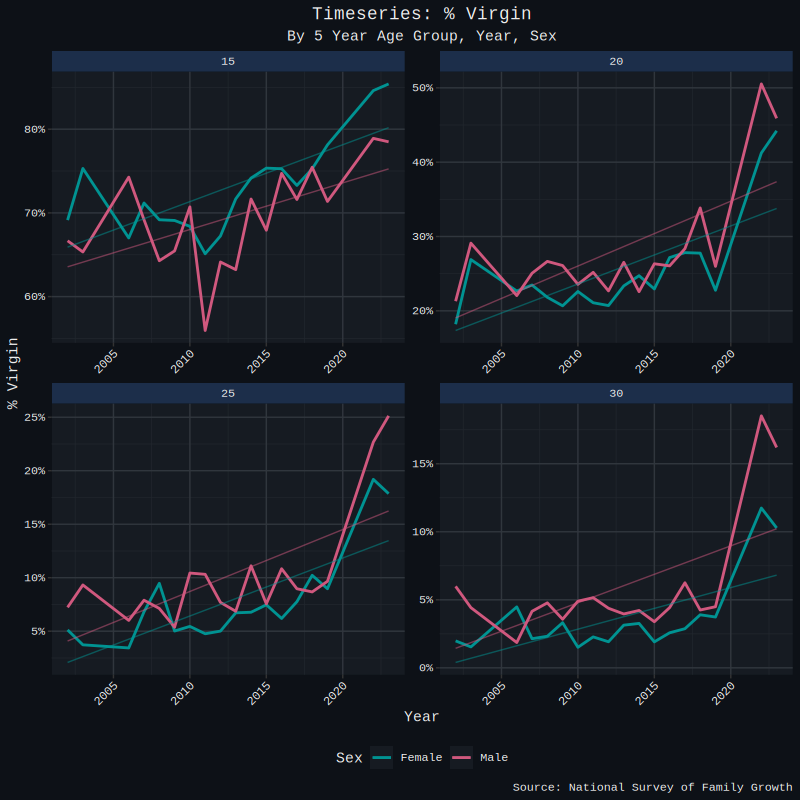
Figure 8: NSFG absolute virginity rates by age and survey year. The 2022–23 release shows pronounced increases in sexlessness across age cohorts compared to earlier waves.
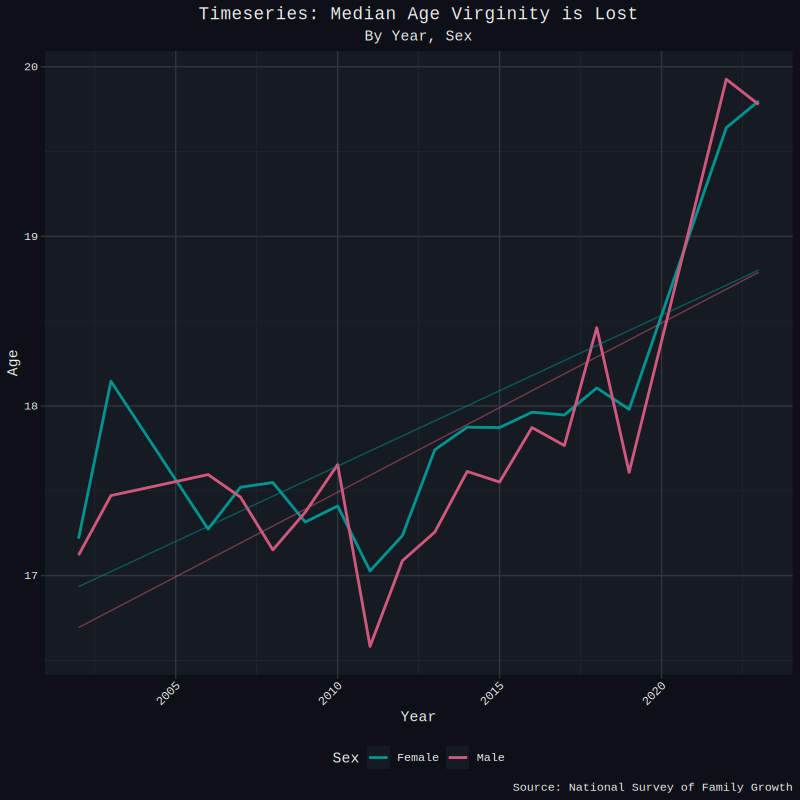
Figure 9: NSFG-derived median age of virginity loss over time. The trend echoes the YRBSS pattern, with sexual debut occurring at progressively older ages.

Figure 10: Relative increase in NSFG virginity rates by age cohort. Rates have grown by sizable percentages, particularly for adults in their twenties and thirties.
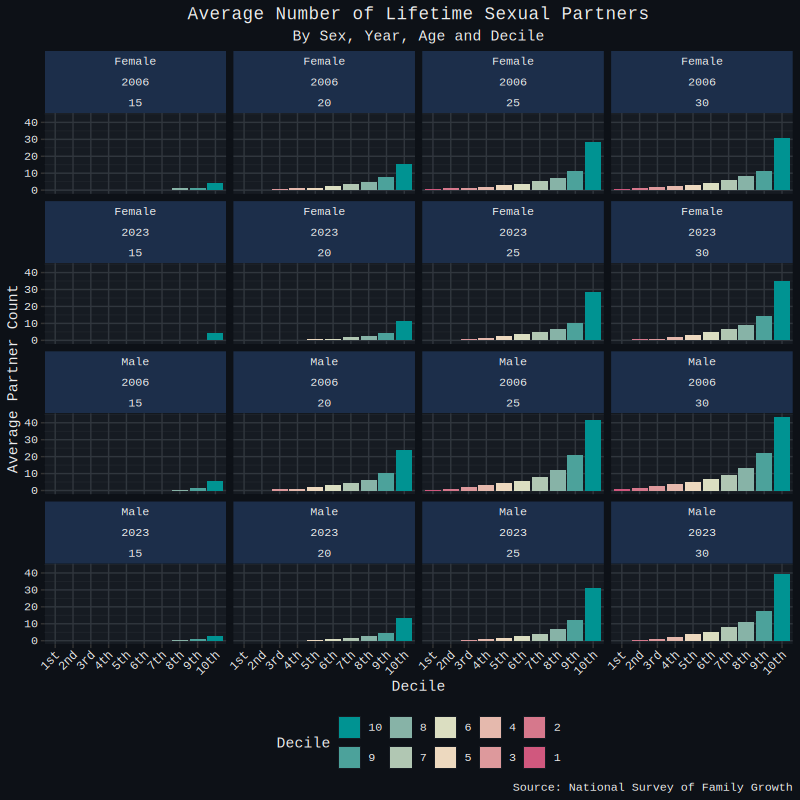
Figure 11: NSFG Lorenz curves of lifetime partner counts. The bottom of the distribution has flattened over time, reflecting the rising share of respondents reporting zero partners.
Inequality in the NSFG
The inequality patterns in the NSFG mirror those we observed in the YRBSS:
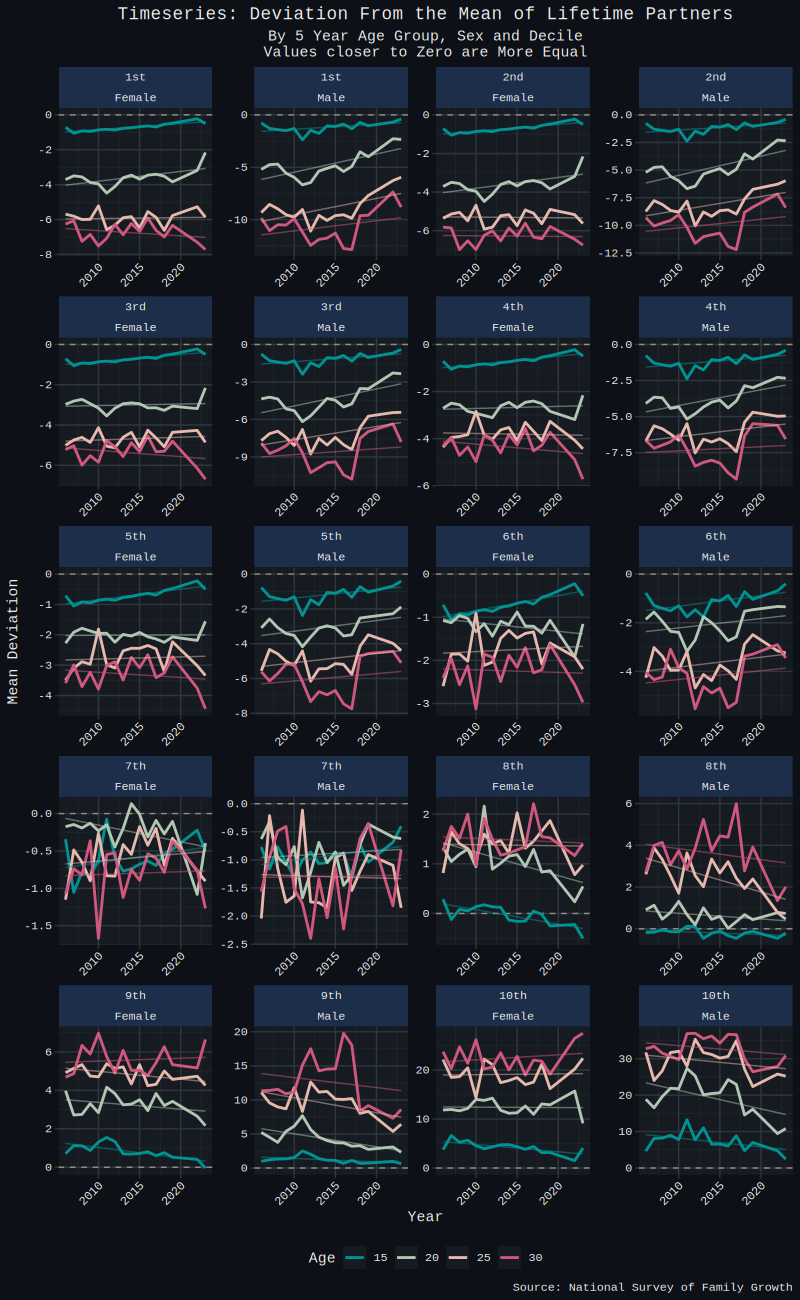
Figure 12: NSFG mean deviations of lifetime partner counts by decile and age. As in the YRBSS, most groups converge toward the population mean, indicating declining absolute inequality.
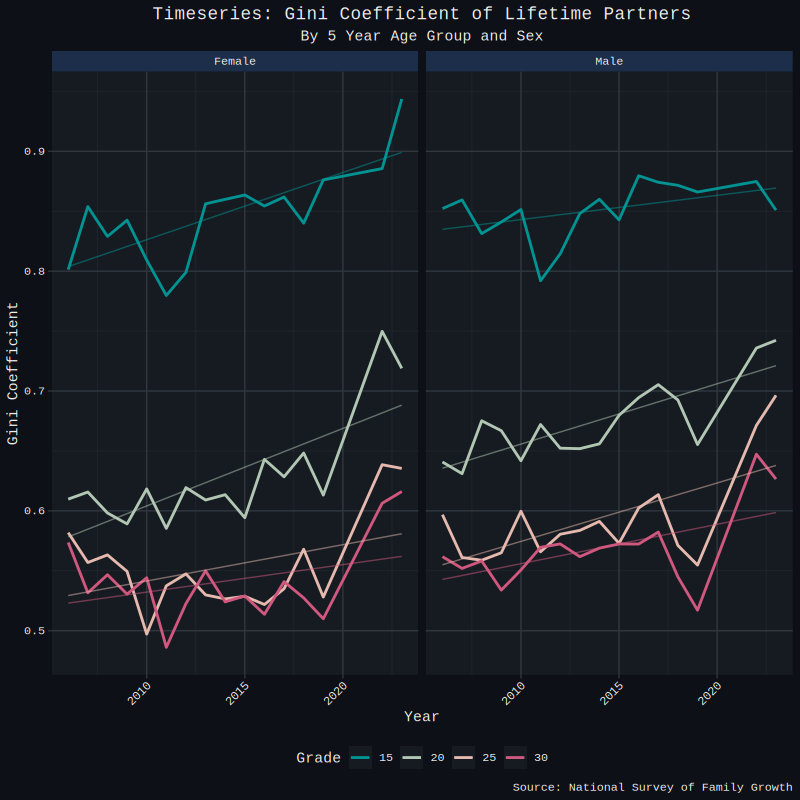
Figure 13: NSFG Gini coefficient of lifetime partner counts by age and year. Relative inequality is rising across age cohorts, mirroring the youth-focused YRBSS findings.
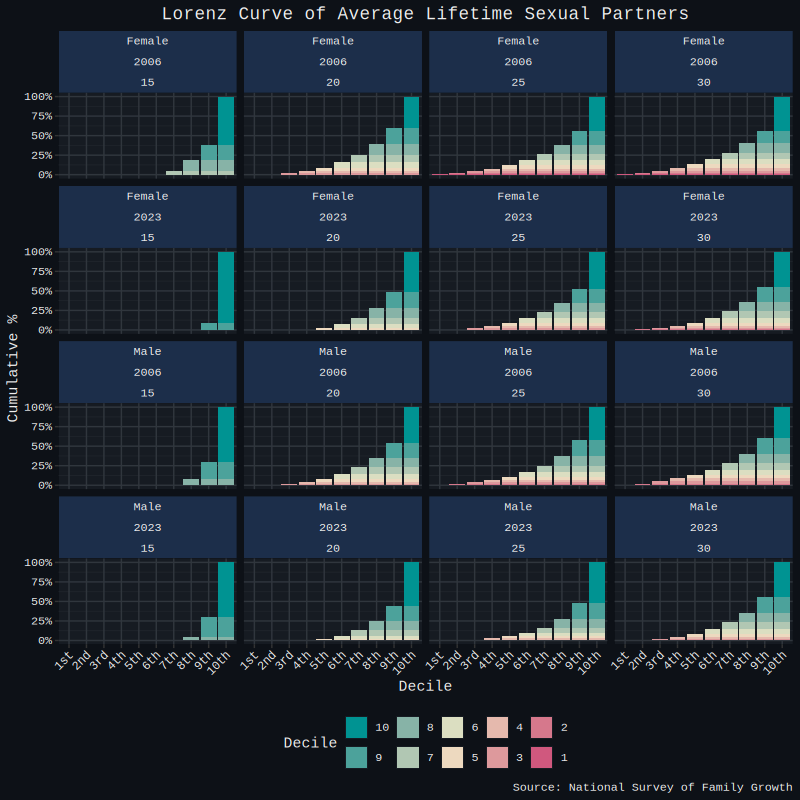
Figure 14: Cumulative Lorenz curves for NSFG lifetime partners over time. Distributional concentration has shifted upward, with a growing share of partners held by the most active decile.
This represents a clear replication of the youth trends in an older, broader population.
Some might argue for caution in interpreting these recent NSFG declines, given that 2022-23 represents the first post-COVID data collection. I disagree with this hesitation for several reasons.
The YRBSS and GSS have been documenting these same trends for decades. The broader pattern was already evident before this latest NSFG release. These new results simply eliminated the final counterargument that could be mounted against the underlying trends.
That said, the NSFG's user guide does advise caution when comparing 2022-23 data to earlier years. The survey shifted from face-to-face interviews to a multimode design, and COVID-19 prevented proper experimental evaluation of this methodological change. These factors suggest potential artifacts may be influencing the apparent trends. Nuance pill wrote an article examining these methodological concerns.
While virginity increases prove statistically significant when examining all age groups combined, the trends within individual age cohorts (20, 25, 30) don't reach significance independently.
Notably, the widening gender gap in virginity rates that we observed in the YRBSS doesn't appear in the NSFG data.
nsfg_stnd %>%
  group_by(age, year, sex) %>%
  mutate(age = round(age/5, 0) * 5) %>%
  summarise(virgin = mean(not_virgin == 2, na.rm = TRUE)) %>%
  filter(age <= 30) %>%
  mutate(age = as.factor(age)) %>%
  lm(data = ., virgin ~ year * age + year * sex) %>%
  broom::tidy()
The fitted coefficients:
| term | estimate | std.error | statistic | p.value |
|---|---|---|---|---|
| (Intercept) | -11.4 | 2.78 | -4.12 | 0.0000659 |
| year | 0.00604 | 0.00138 | 4.37 | 0.0000242 |
| age20 | -4.64 | 3.51 | -1.32 | 0.189 |
| age25 | 0.547 | 3.51 | 0.156 | 0.877 |
| age30 | 4.50 | 3.51 | 1.28 | 0.202 |
| sexMale | -0.584 | 2.48 | -0.235 | 0.815 |
| year:age20 | 0.00208 | 0.00175 | 1.19 | 0.235 |
| year:age25 | -0.000581 | 0.00175 | -0.333 | 0.740 |
| year:age30 | -0.00257 | 0.00175 | -1.47 | 0.144 |
| year:sexMale | 0.000295 | 0.00123 | 0.239 | 0.812 |
Table 4: NSFG regression of virginity rate on year, age cohort, and sex. The overall year effect is significant, but the non-significant year:sexMale interaction indicates the widening gender gap seen in the YRBSS does not appear in the NSFG.
This again illustrates the absolute/relative inequality distinction: the youngest cohorts show the highest relative inequality yet the lowest absolute deviations.
Reasons for Remaining Virgin
The NSFG provides unique insight into motivations for virginity through several variables: stated reasons for remaining virgin, how much respondents wanted their first sexual experience when it occurred, and sexual orientation patterns.
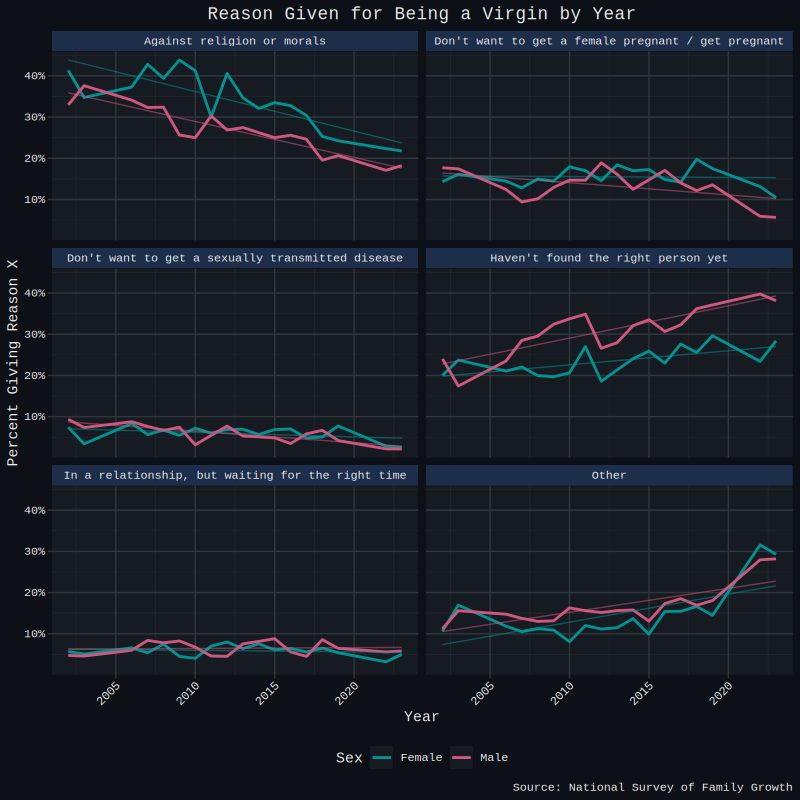
Figure 15: NSFG stated reasons for remaining virgin by year. Religious and morals-based motivations decline sharply, while involuntary-leaning categories ('Other' and "Haven't found the right person") rise.
The most striking pattern here is religion's decline as a reason for virginity. This directly contradicts the Institute for Family Studies' argument that "we're having less sex because of religion" (Stone, 2021). Their analysis suggested that increasing religiosity among youth was driving sexlessness trends.
But this gets the causation backwards. If sexual activity is declining universally, we'd naturally expect religious people to have less sex too, not because religious attitudes are strengthening, but because the overall trend affects everyone. The data clearly shows religious motivations for virginity are actually weakening over time.
The potentially involuntary reasons, 'Other' and "Haven't found the right person", are both increasing substantially.
If these responses truly reflect involuntary virginity, we should see them become more common with age.
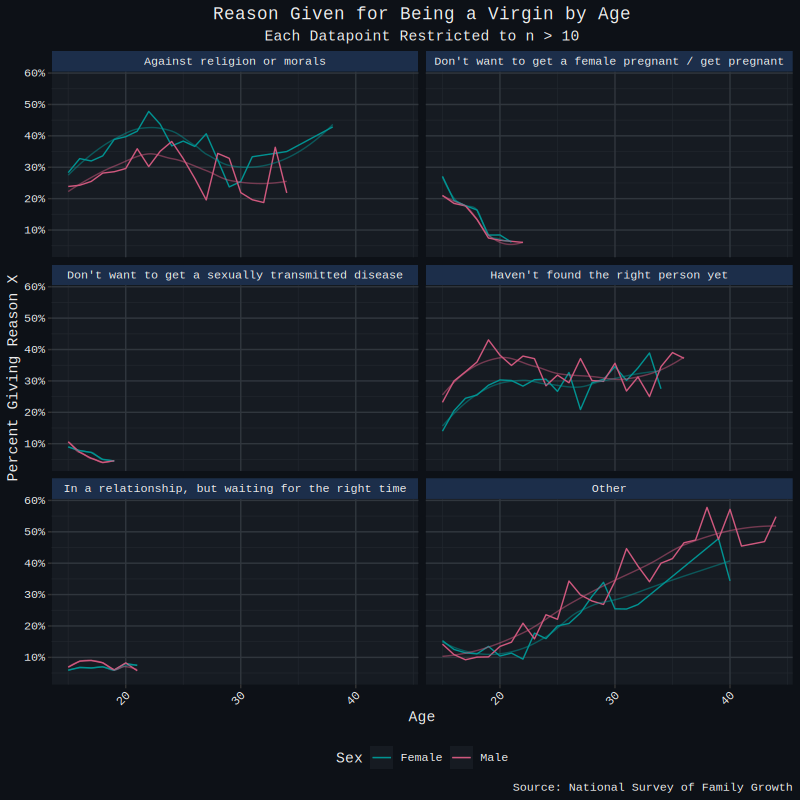
Figure 16: Reasons for virginity by age. 'Other' rises steeply with age, consistent with involuntary circumstances; religious reasons fall as older virgins become rarer.
The age patterns support our interpretation. 'Other' increases dramatically with age, exactly what we'd expect if it represents involuntary circumstances. "Haven't found the right person" remains relatively constant across the twenties; if this reflected a clear voluntary choice, we might expect it to vary more systematically with age (possibly decline). Religious reasons decline in older age groups, likely reflecting both marriage patterns among religious individuals and broader generational shifts in religiosity.
The classification challenge remains that most stated reasons appear voluntary rather than involuntary. Only "Haven't found the right person" clearly suggests involuntary circumstances. The 'Other' category is inherently ambiguous, but given that most major voluntary reasons are explicitly covered elsewhere, this residual category likely captures predominantly involuntary situations.
Desire to Lose Virginity
We can test whether 'Other' truly represents involuntary virginity by examining the WANTEDSX variable, which measures how much respondents wanted their first sexual experience when it occurred. If men are becoming increasingly desperate to lose their virginity as they age, we'd expect to see heightened desire among those who finally do have sex.
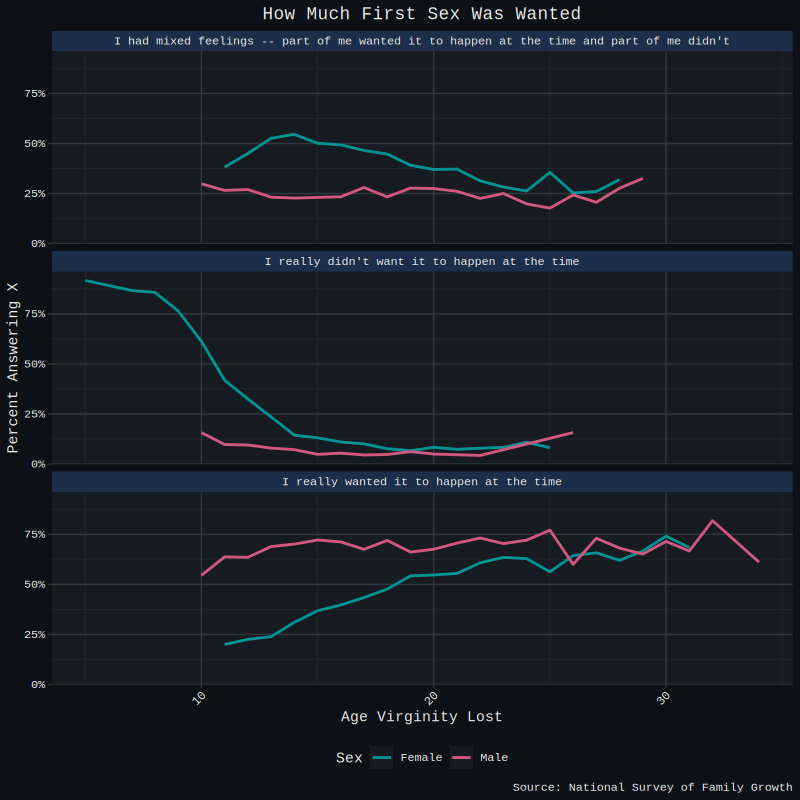
Figure 17: NSFG WANTEDSX responses by age and sex. Men show stable high desire for first sex across ages; women's responses include a troubling share of non-consensual experiences.
The patterns here are revealing, though the rape statistics for women represent a deeply troubling aspect of these data. Setting that aside, men show relatively constant levels of desire across ages. To quantify this more precisely, I converted responses to a continuous scale: 'I really wanted' = 1, middle response = 0.5, and "I didn't want" = 0.
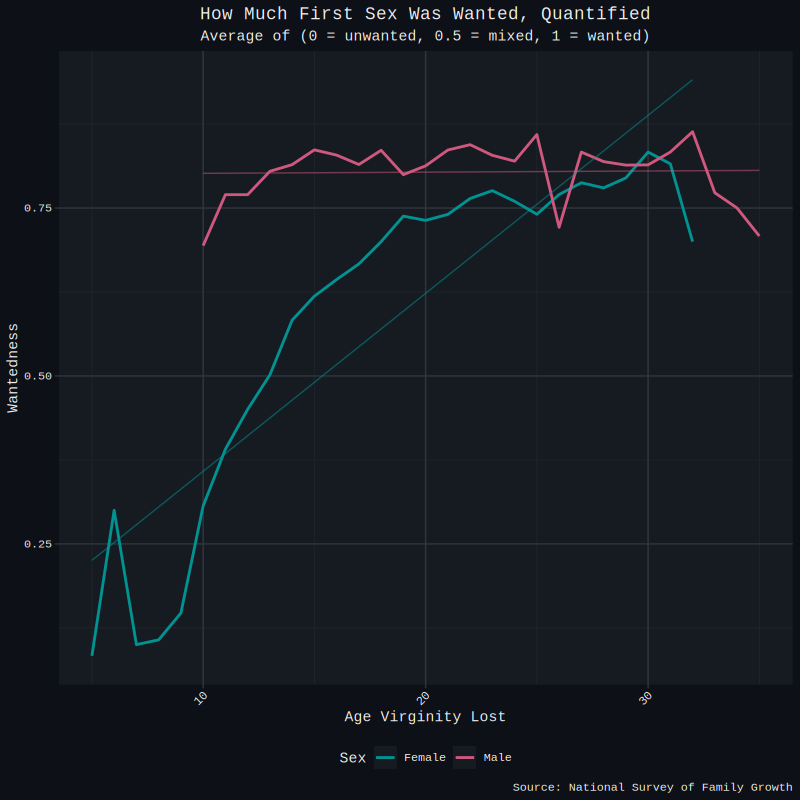
Figure 18: WANTEDSX rescaled to a 0–1 desire score. Men maintain high wanting across ages, while women's reported desire rises with age, suggesting the sexes converge on similar desire levels.
Men and women appear to converge in their reported desire for first sexual experiences. If anything, men maintain consistently high levels of wanting across all ages, while women show some increase with age.
This pattern somewhat contradicts the hypothesis that 'Other' represents an increasingly desperate demographic, at least for men. The data suggests men maintain constant eagerness regardless of age, rather than showing the escalating desperation we might expect from prolonged involuntary celibacy. For women, there may be more support for this interpretation.
The Asexuality Question
Could rising asexuality explain the increase in 'Other' responses? The NSFG captures sexual attraction through the ATTRACT variable:
| Code | Label |
|---|---|
| 1 | Only Opposite Sex |
| 2 | Mostly Opposite Sex |
| 3 | Equally Opposite and Same Sex |
| 4 | Mostly Same Sex |
| 5 | Only Same Sex |
| 6 | Not Sure |
| 7 | Not ascertained |
| 8 | Refused |
| 9 | Don't know |
Table 5: NSFG ATTRACT variable codes. Codes 6–9 are treated as proxies for asexuality or sexual uncertainty in the analysis below.
I classify responses 6-9 as potential indicators of asexuality or sexual uncertainty.
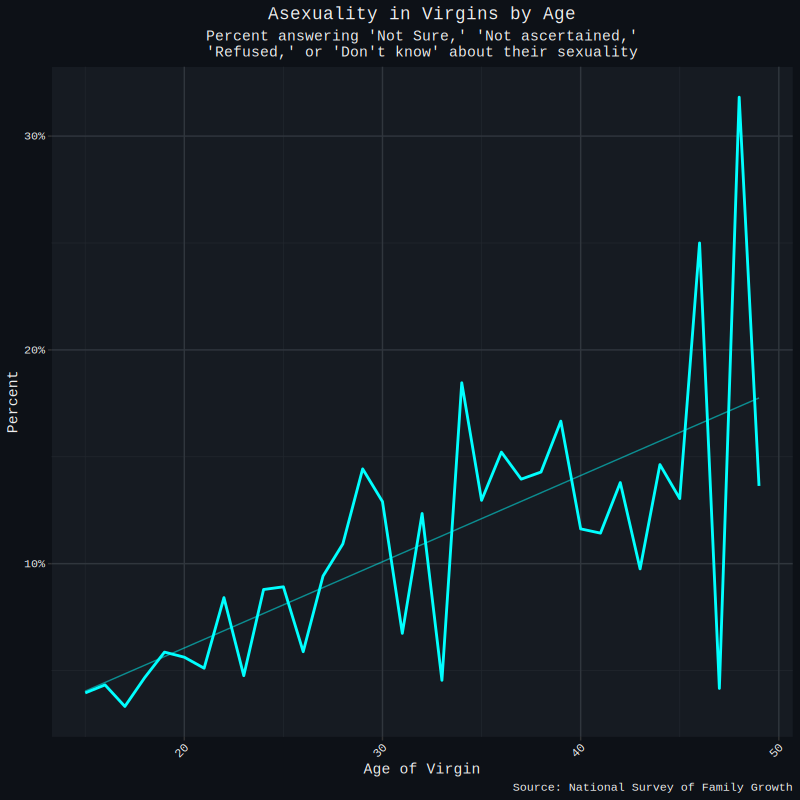
Figure 19: Share of NSFG respondents giving "Not sure / Refused / Don't know" attraction responses, used as a proxy for asexuality. The share rises with age but caps at ~15%, far short of the 60% citing 'Other' for virginity.
While these responses do increase with age as expected, asexuality can't account for the majority of 'Other' virginity reasons. At most, these categories cover about 15% of virgins, while 60% select 'Other' as their reason. This suggests most 'Other' responses reflect circumstances more consistent with involuntary celibacy rather than asexuality.
Breaking this down by year and sex reveals potentially interesting patterns, though we must interpret cautiously given extremely small sample sizes (median n ≈ 15 per data point):
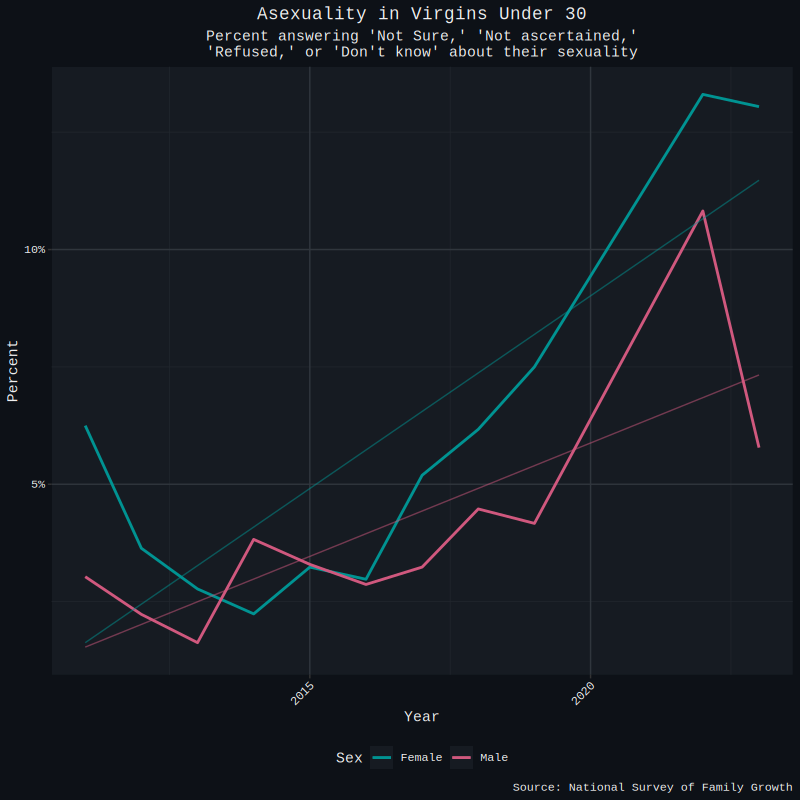
Figure 20: Asexuality-proxy responses by year and sex (median n ~15 per cell). Despite noisy data, an upward trend is visible across cohorts.
There does appear to be an upward trend worth monitoring as more data becomes available.
Incels Rising
Having examined the nuances of different virginity reasons, I can now classify them along the voluntary/involuntary spectrum:
| Code | Reason | Classification |
|---|---|---|
| 1 | Against religion or morals | Voluntary |
| 2 | Don't want to get a female pregnant / get pregnant | Voluntary |
| 3 | Don't want to get a sexually transmitted disease | Voluntary |
| 4 | Haven't found the right person yet | Involuntary |
| 5 | In a relationship, but waiting for the right time | Voluntary |
| 6 | Other | Involuntary |
| 8 | Refused | Involuntary |
| 9 | Don't know | Involuntary |
Table 6: NSFG stated reasons for remaining virgin, with my voluntary/involuntary classification used to construct the trends in the figures below.
While many of these "involuntary" classifications remain ambiguous, they're more likely involuntary than not given the exclusion of major voluntary reasons.
The trends by year tell a striking story:
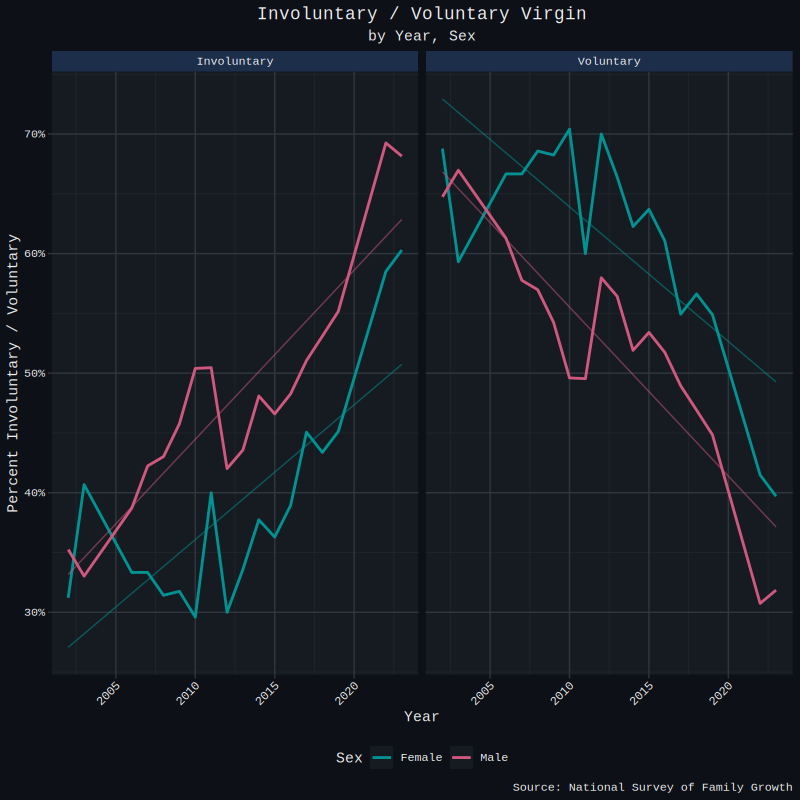
Figure 21: Share of virginity reasons classified as involuntary, by year and sex. Involuntary classifications are increasingly dominant, especially among men.
Involuntary reasons for virginity appear to be increasingly dominating among men, with women following a similar but less pronounced pattern. This aligns with certain aspects of Incel theory, which often characterizes female virginity as more voluntary than male virginity.
Age patterns reinforce this interpretation:
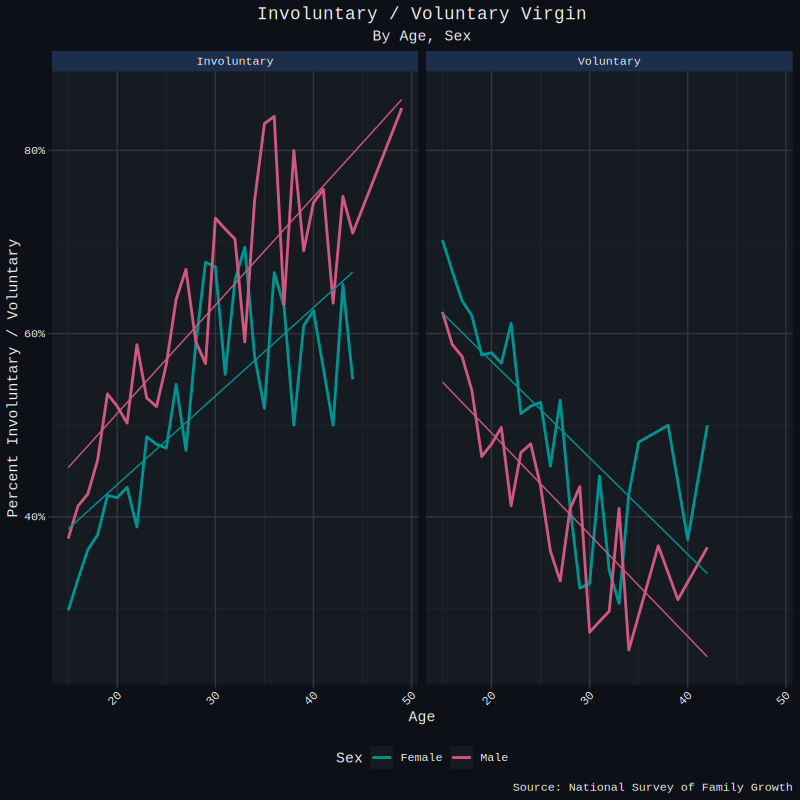
Figure 22: Involuntary share of virginity reasons by age and sex. The proportion classified as involuntary rises sharply with age across both sexes, supporting the involuntary-celibacy interpretation.
As expected, involuntary reasons become more prevalent with age across both sexes.
NSFG Conclusions
While increases in sexlessness and partner counts don't reach statistical significance in the NSFG, they consistently point in the expected direction across multiple measures.
More importantly, the data clearly indicates a shift from voluntary to involuntary reasons for virginity, even accounting for the ambiguous nature of some classifications.
The declining role of religion offers one potential explanation for rising involuntary celibacy. For previous generations, religious commitment provided a socially acceptable framework for remaining virgin until marriage, a choice individuals could embrace with genuine conviction. As religiosity declines among younger Americans, this cultural safety net has largely disappeared, leaving sex as an unmarked norm without traditional taboos.
This cultural shift may leave sexually unsuccessful men particularly vulnerable. Without religious justification for abstinence, the natural male inclination toward sexual pursuit becomes more prominent but remains unsatisfied, potentially contributing to feelings of involuntary deprivation.
This remains speculative, but the correlation between declining religious explanations and rising involuntary reasons deserves serious consideration.
Sexlessness in the GSS
For readers who've made it this far, the General Social Survey needs little introduction. Its unique strengths include an extensive age range, diverse variables beyond sexuality, decades of historical data, and crucially, measures of sexual frequency rather than just partner counts.
Starting with sexual frequency patterns:
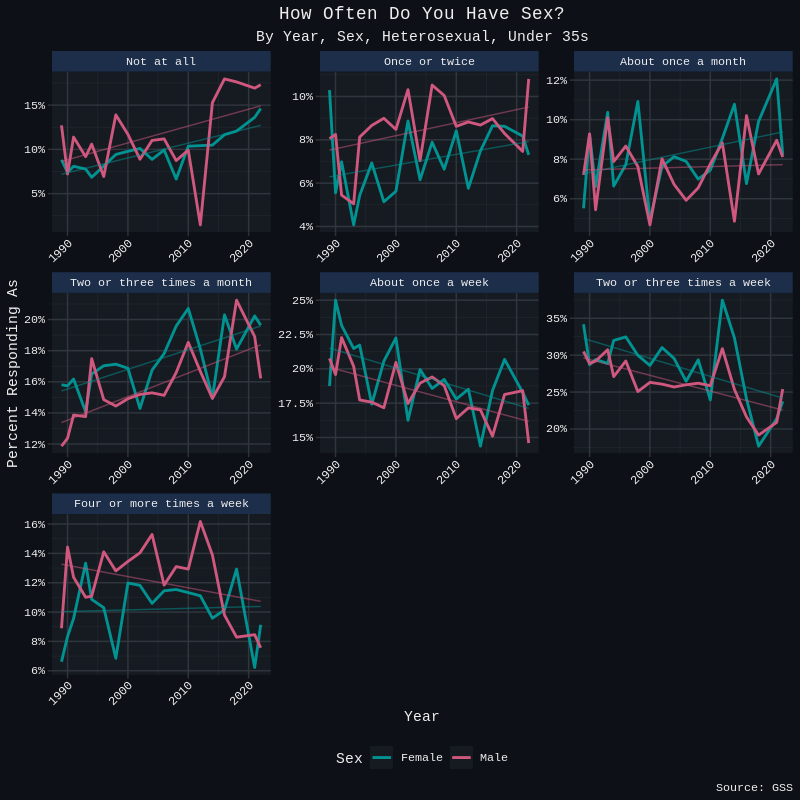
Figure 23: GSS sexual frequency response distribution by year and sex. The lowest-frequency categories grow over time while the highest decline, signaling a population-wide drop in sexual activity.
The trends are unmistakable: lower frequency responses are becoming more common while higher frequencies decline. This represents a clear shift toward reduced sexual activity across the population.
Annual partner counts show an even starker pattern:
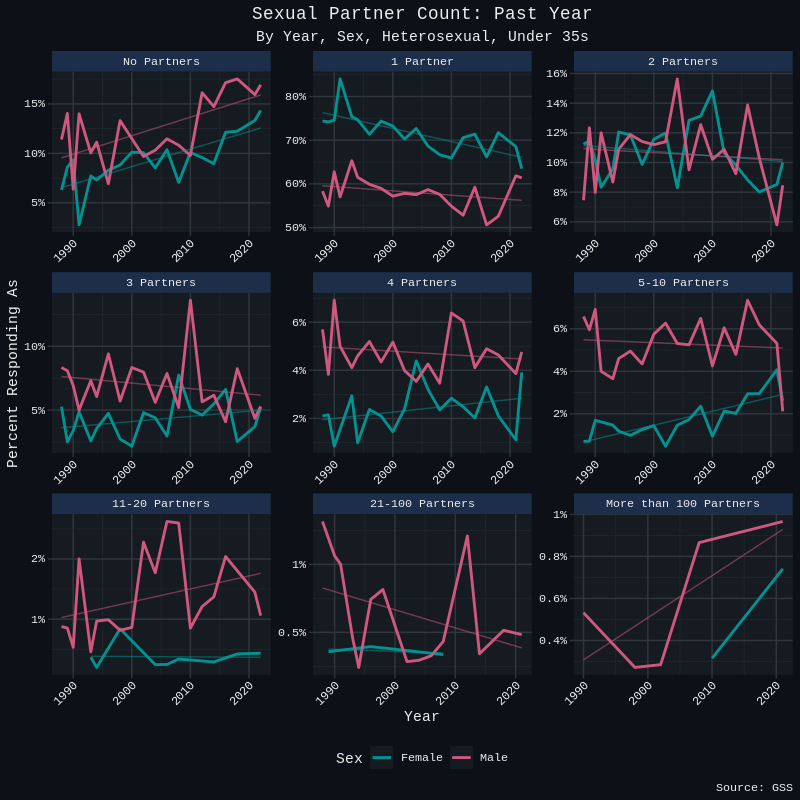
Figure 24: GSS annual partner-count distribution by year and sex. The 'No Partners' share rises steeply over time, dwarfing trends in any other category.
The 'No Partners' category shows the strongest trend of any response. Note that bottom-row data points should be disregarded due to extremely small sample sizes (approximately n=10 each).
For measuring virginity, the GSS offers one viable variable: total sexual partners since age 18. The proportion reporting zero partners provides our best proxy:
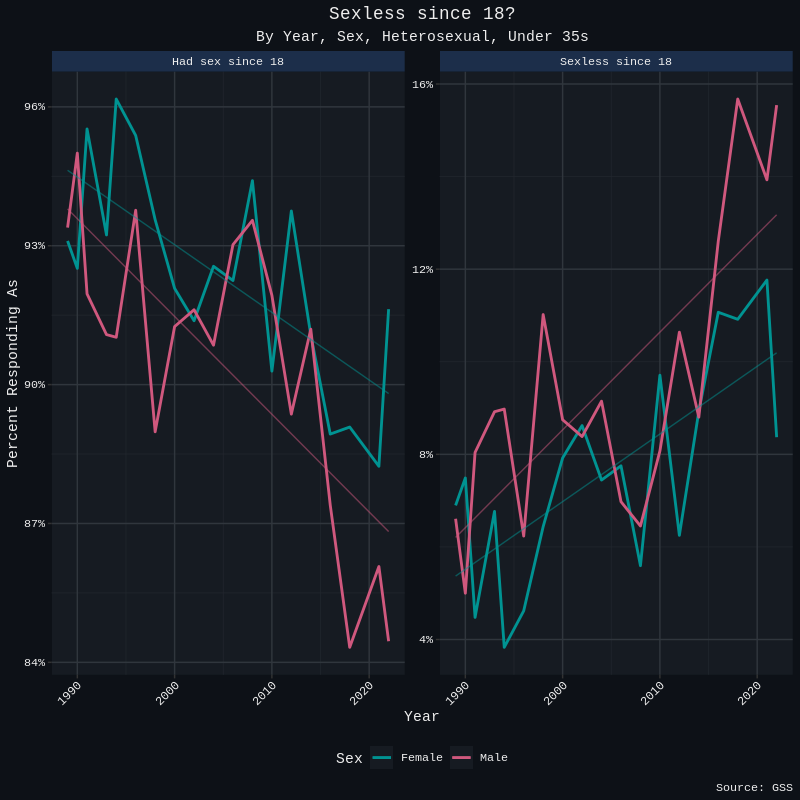
Figure 25: GSS proportion reporting zero partners since age 18, by year and sex. The share roughly doubles over thirty years, decisively refuting claims that the GSS shows no rising sexlessness.
This represents the most dramatic increase of any measure we've examined. Following the linear regression trend, we're looking at a doubling over thirty years, definitively refuting claims that "the GSS doesn't show declining sexlessness."
Inequality in the GSS
To examine inequality patterns, I converted the categorical SEXFREQ and PARTNERS variables into continuous measures. Sexual frequency was quantified as instances per week using these conversions:
| Code | sexfreq | partners |
|---|---|---|
| 0 | 0 | 0 |
| 1 | 1.5/52 | 1 |
| 2 | 12/52 | 2 |
| 3 | 30/52 | 3 |
| 4 | 1 | 4 |
| 5 | 2.5 | 7.5 |
| 6 | 5 | 15.5 |
| 7 | 60.5 | |
| 8 | 30 |
Table 7: GSS conversions from categorical SEXFREQ and PARTNERS codes to continuous measures (sexual frequency in instances per week, partner counts as midpoints of bins). Empty cells mark codes that have no corresponding bin in that variable.
The relative inequality trends match our expectations:
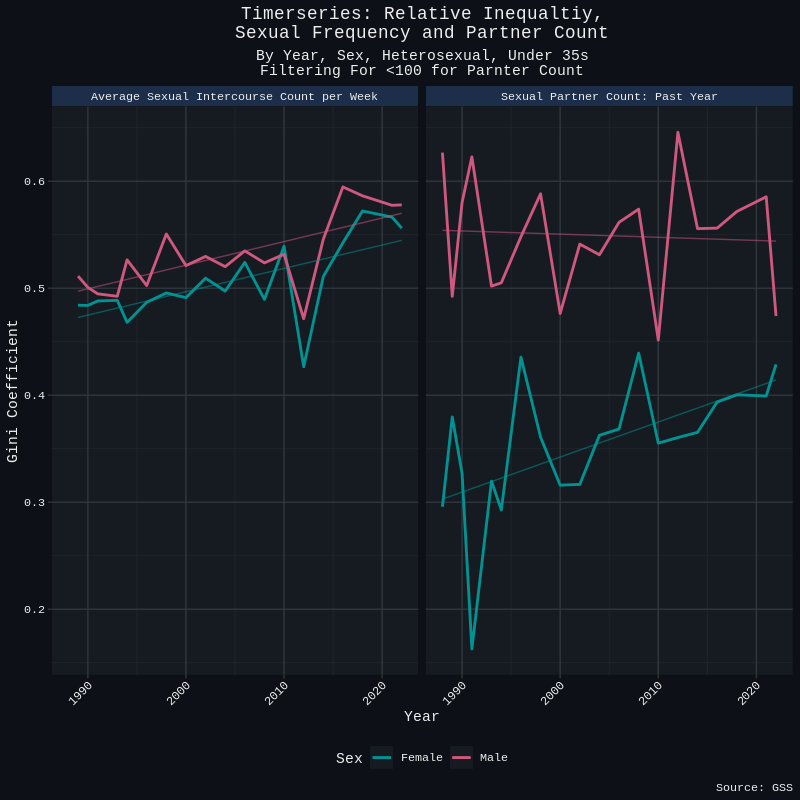
Figure 26: GSS Gini coefficients of sexual frequency and partner counts by year and sex. Relative inequality climbs across both measures, with sexual frequency showing the clearest upward trend.
Sexual frequency shows clear increases in relative inequality over time.
For absolute inequality measures:
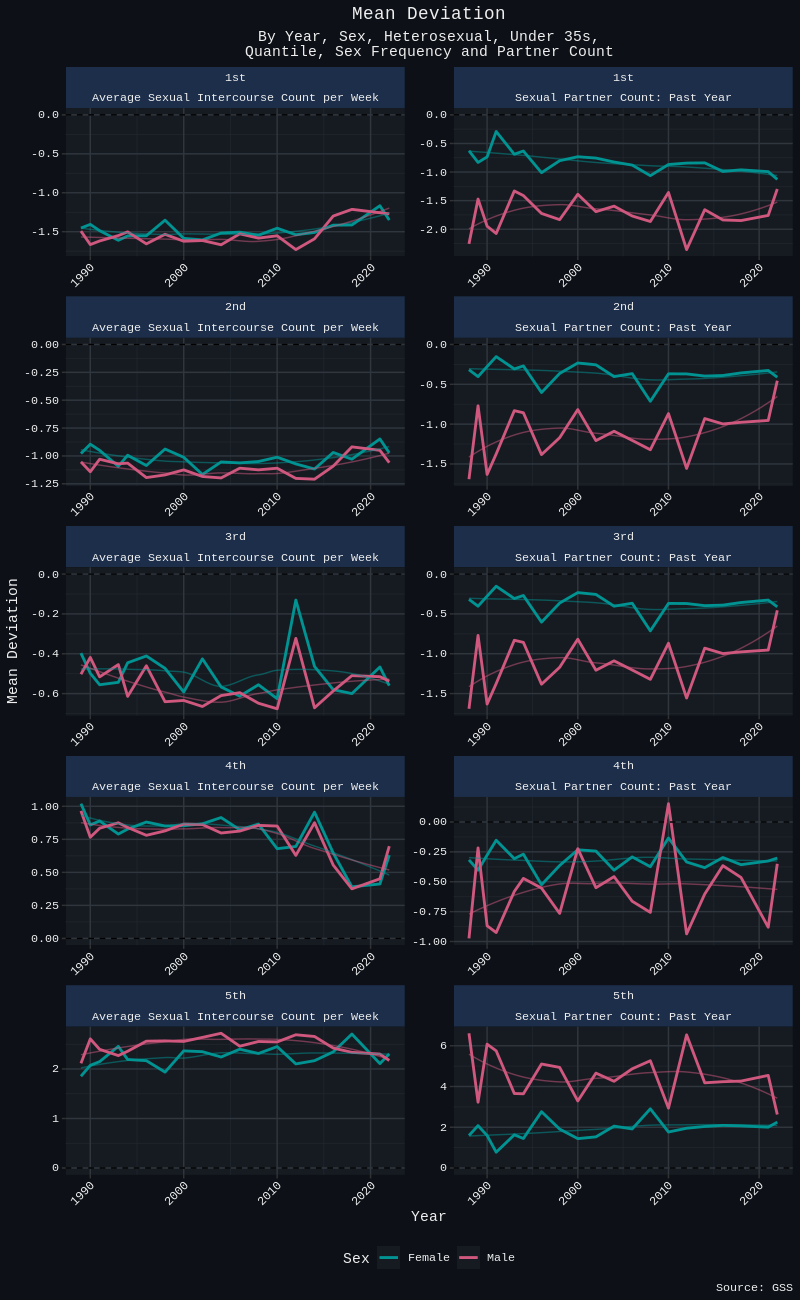
Figure 27: GSS absolute deviations from the mean by quintile and year. The lowest quintile converges toward zero, indicating absolute inequality is shrinking even as relative inequality grows.
Particularly for sexlessness, the first quintile appears to be converging toward the mean (zero), suggesting declining absolute inequality even as relative inequality rises.
Is Everyone Affected?
The GSS's broad age range allows us to examine whether these trends affect all demographics or concentrate in specific age groups:
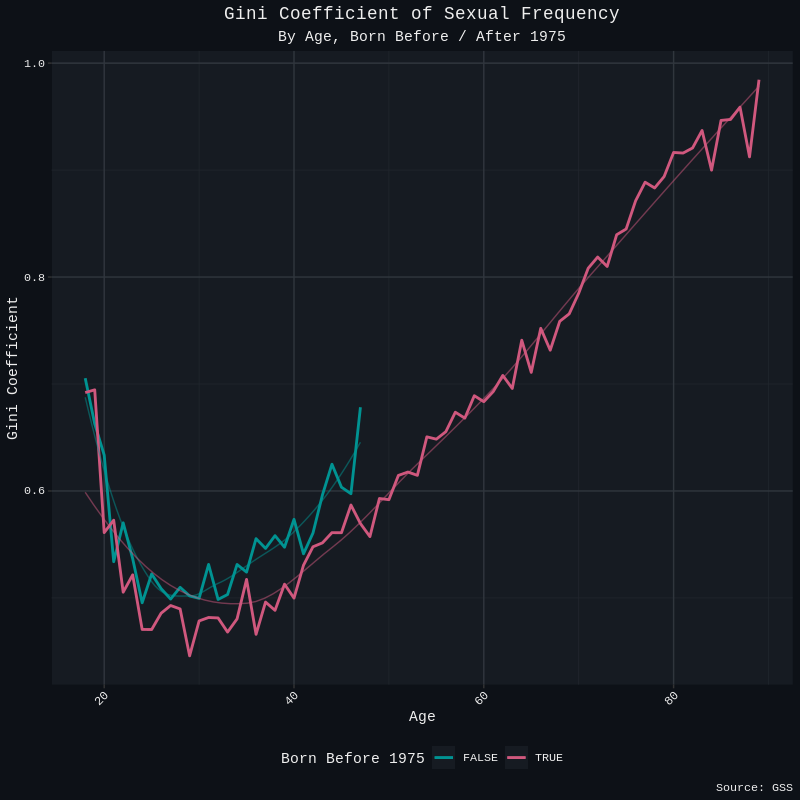
Figure 28: GSS sexual-frequency Gini coefficient by birth cohort (pre-/post-1975). Relative inequality has risen across age groups, suggesting the trend is not confined to a single cohort.
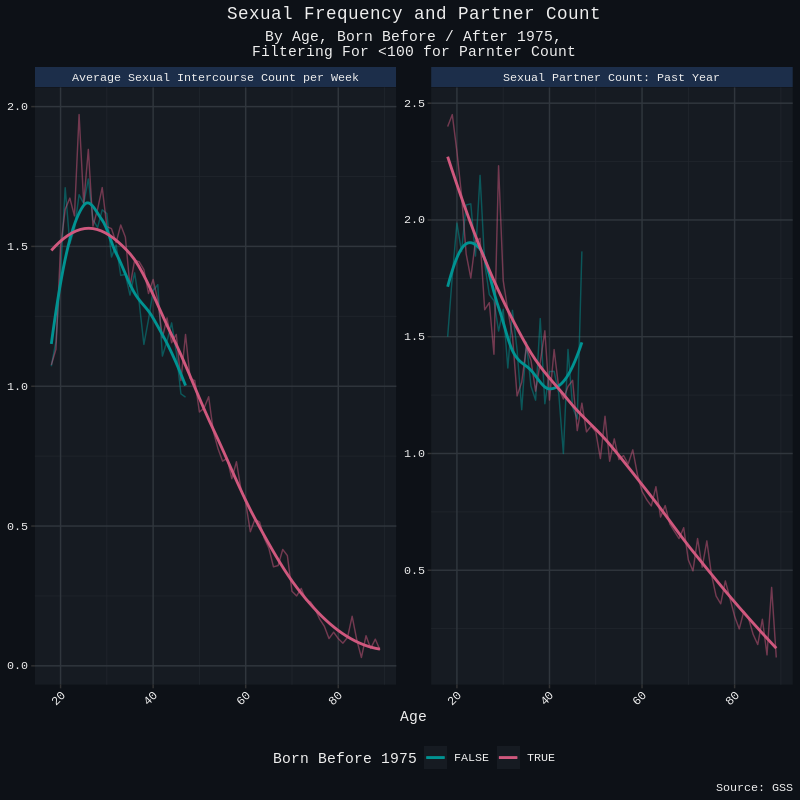
Figure 29: GSS sexual frequency and partner trends split by birth cohort. Underlying variable trends are noisier than the Gini, making it harder to claim every cohort is equally affected.
While relative inequality appears to be rising across age groups, the individual variable trends remain somewhat ambiguous, making it difficult to definitively conclude whether all demographics are equally affected.
Where are the Incels?
Given rising sexlessness across all three datasets, we might expect parallel increases in Incel-related online activity. To test this, I examined US Google Trends data using Elliot Rodger searches as a proxy for Inceldom:
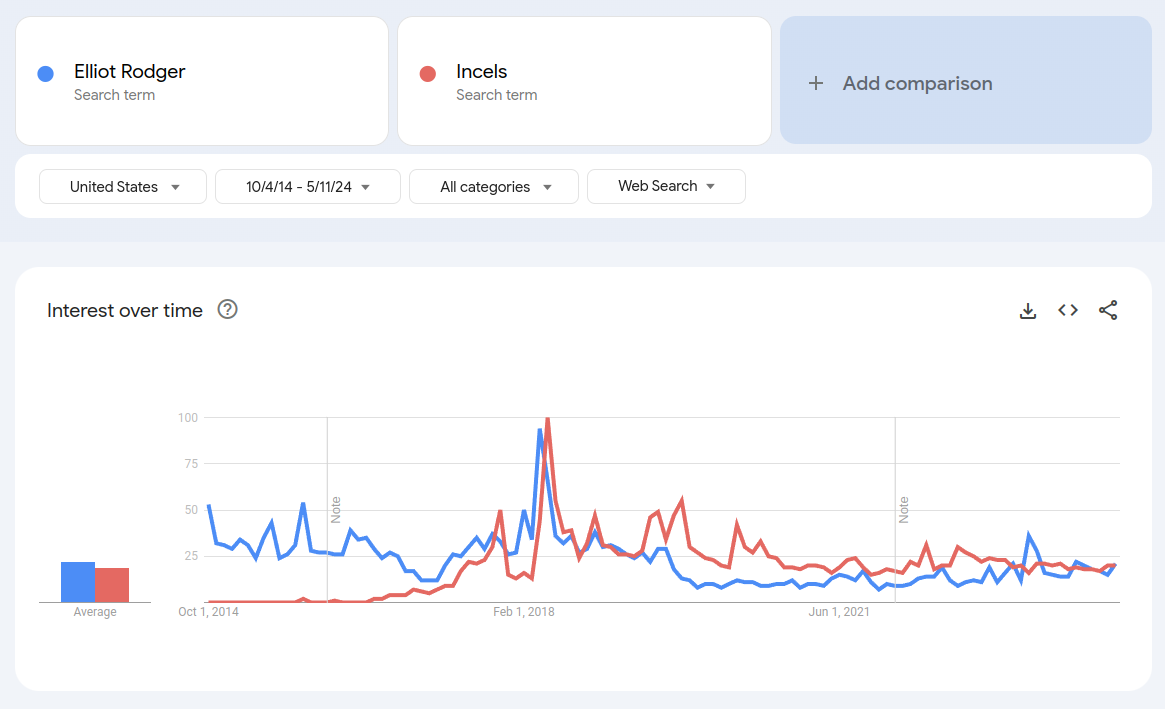
Figure 30: US Google Trends for "Elliot Rodger" as a proxy for Incel-related interest. Search volume stays roughly flat despite rising sexlessness, hinting at selection effects in who joins these communities.
Surprisingly, the trends remain relatively flat. This disconnect could reflect two possibilities: either Incel culture's brief history makes it too recent to capture longer-term sexlessness patterns, or we're observing a selection effect.
The selection effect explanation seems more plausible. Early Incels represent a highly specific demographic: disproportionately mentally ill, NEET (Not in Education, Employment or Training), and likely possessing higher-than-average libidos.
As sexlessness spreads to broader populations, however, the newly sexless individuals differ markedly from this prototype. Through simple regression towards the mean, they're more likely to be employed, mentally healthier, and less obsessively focused on sex.
This demographic shift means that most newly sexless individuals probably won't be drawn into the same terminally online ecosystems that captured earlier Incels. This represents genuinely good news; it suggests that rising sexlessness may not translate proportionally into the growth of these communities.
In a more sophisticated analysis, the population of various manosphere communities was measured (Horta Ribeiro et al., 2021).
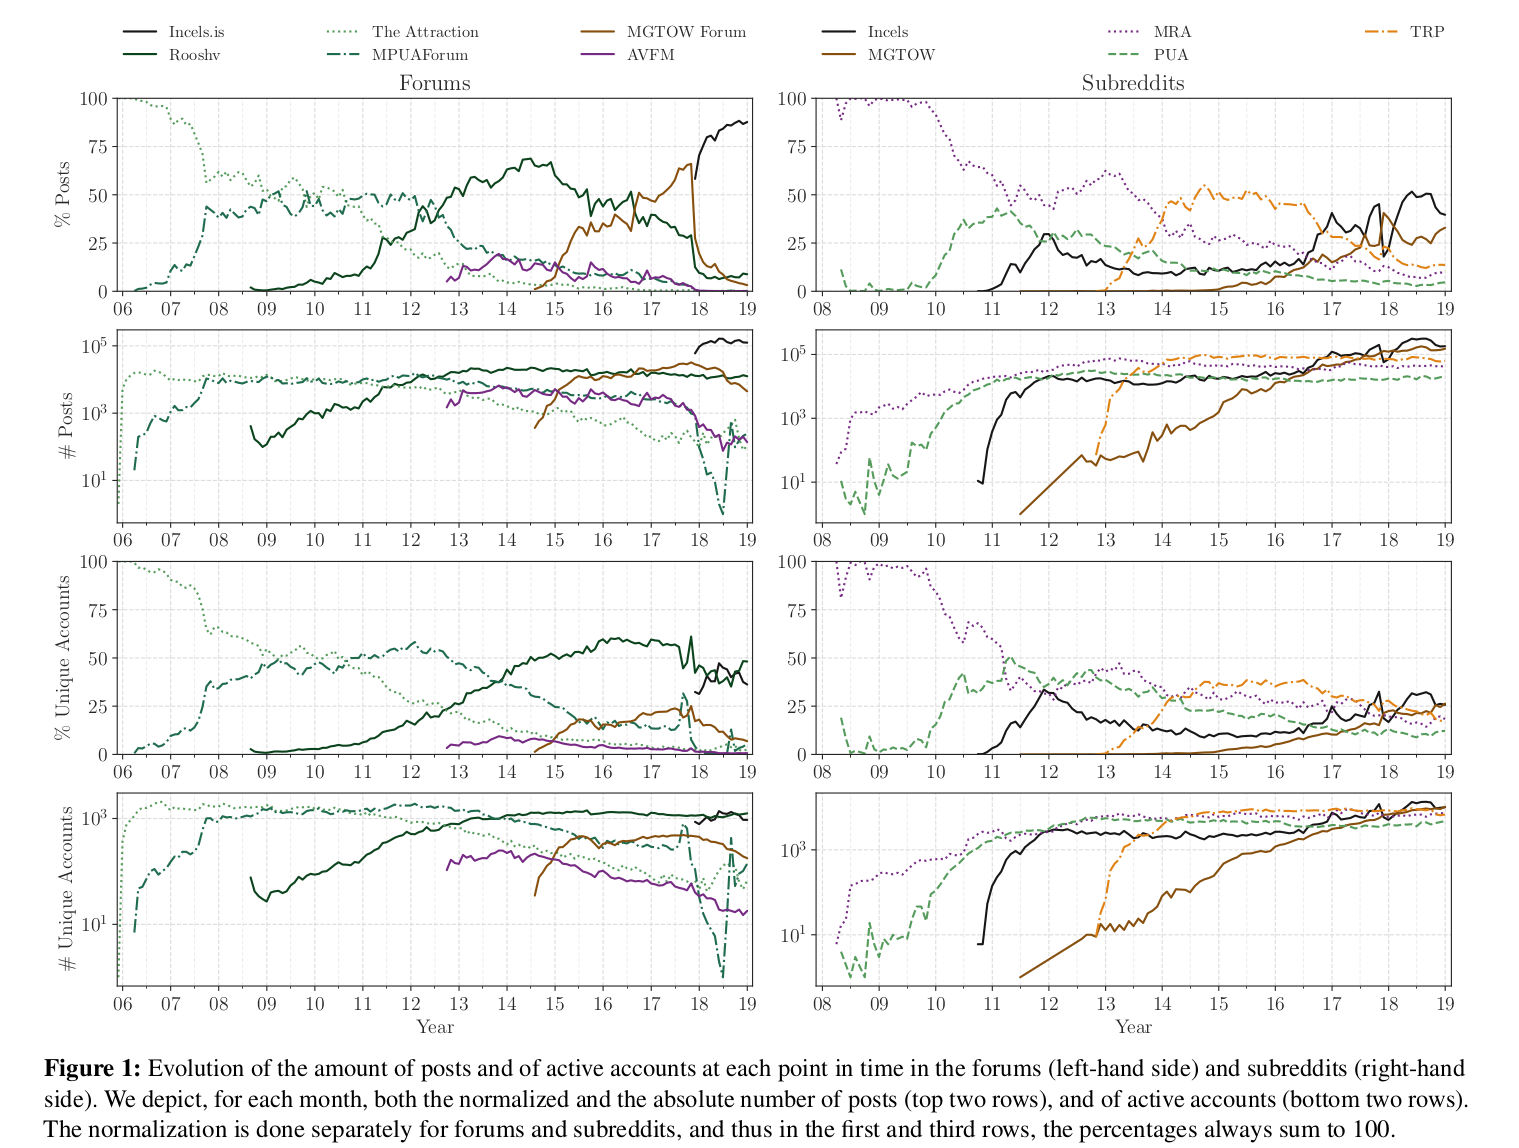
Figure 31: Population of manosphere subcommunities over time, from Ribeiro et al. (2021). Incel forums grew between 2016–2019 alongside the broader manosphere, though absolute volumes remain modest.
Between 2016-2019, Incel communities did show growth, and the broader manosphere appears to have expanded since its inception. However, several factors complicate this interpretation:
- Internet user populations have grown massively, so we need to consider whether activity has increased relative to overall internet usage
- The data reflects international patterns rather than specifically US trends
- Selection effects may mean that those most predisposed to Incel ideology were simply early internet adopters
Conclusions
The evidence from US data reveals several consistent patterns:
- Youth virginity rates are increasing while sexual frequency and partner counts decline
- The NSFG initially appeared to contradict these trends, but the 2023 release brought it into alignment with both YRBSS and GSS findings
- Sexual milestones continue to be reached, but at progressively older ages
- Stated reasons for virginity are shifting from voluntary to involuntary
- Relative sexual inequality is rising dramatically
- Absolute inequality, paradoxically, continues to decline
These findings suggest that American sexual behavior is undergoing a significant transformation, with implications that extend far beyond simple statistics about sexual activity.